Module 01 · Detect · Be An Earth System Trend Detective!

Hot Spots Harmonizer

One fire record from 2000 to 2025, on a single sensor scale.

nasa-spaceapps-2026.pages.dev/hotspots/app/Full screen ↗

Interactive and fully static: everything runs in your browser from precomputed data. Use the "Experiment briefing" button inside the tool for a guided walkthrough.

WhyThe problem this module solves

Fire managers can't compare a 2005 fire season with a 2023 one, because NASA's fire record switches sensors in 2012 and VIIRS sees about 5.6 times more fire than MODIS. Without one consistent record, no one can say if fire is really increasing.

NASA has watched fires from orbit since 2000, but the record is split. MODIS (1 km pixels, from 2000) and VIIRS S-NPP (375 m pixels, from 2012) see fire differently: over Canada since 2012, VIIRS reports about 5.6 detections for every MODIS detection.

So a fire manager can't put a 2005 season next to a 2023 season and trust the comparison. Hot Spots merges both records into one burning-activity calendar for any area, so a trend can be read across the sensor switch.

The data story · Detect

From scattered detections to a fire record you can trust.

Five beats: the raw signal, what changed, how sure we are, where it gets subtle, and who acts on it.

01 · The signal

11.6 million fire pixels, two sensors.

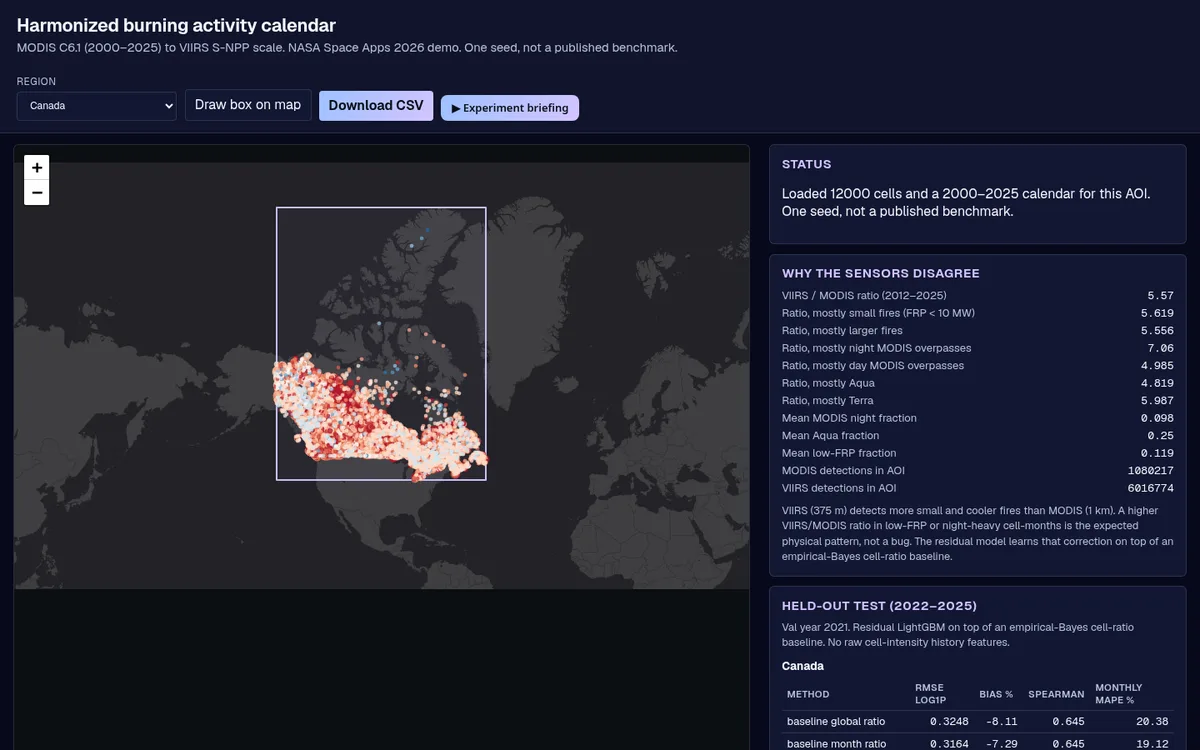
NASA FIRMS records every fire a satellite sees: MODIS since 2000, VIIRS since 2012. Over Canada since 2012, VIIRS reports about 5.6 times more fire than MODIS for the same ground, so the raw record jumps when the sensor changes.

Hot Spots joins them into one 2000–2025 calendar per area, so a 2005 season and a 2023 season sit on the same scale.

The harmonized fire calendar for Canada in the live tool: FIRMS detections per 0.25° cell.

02 · What changed

Burned area is climbing, and 2023 stands out.

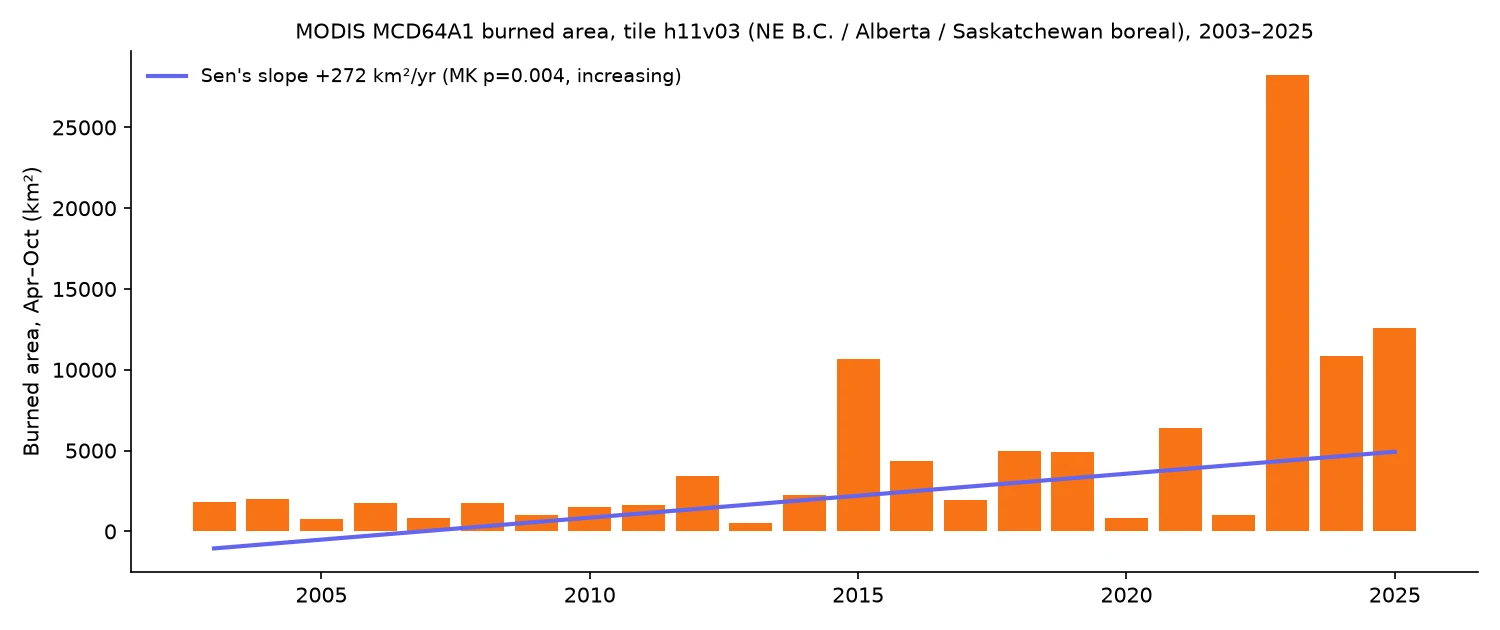
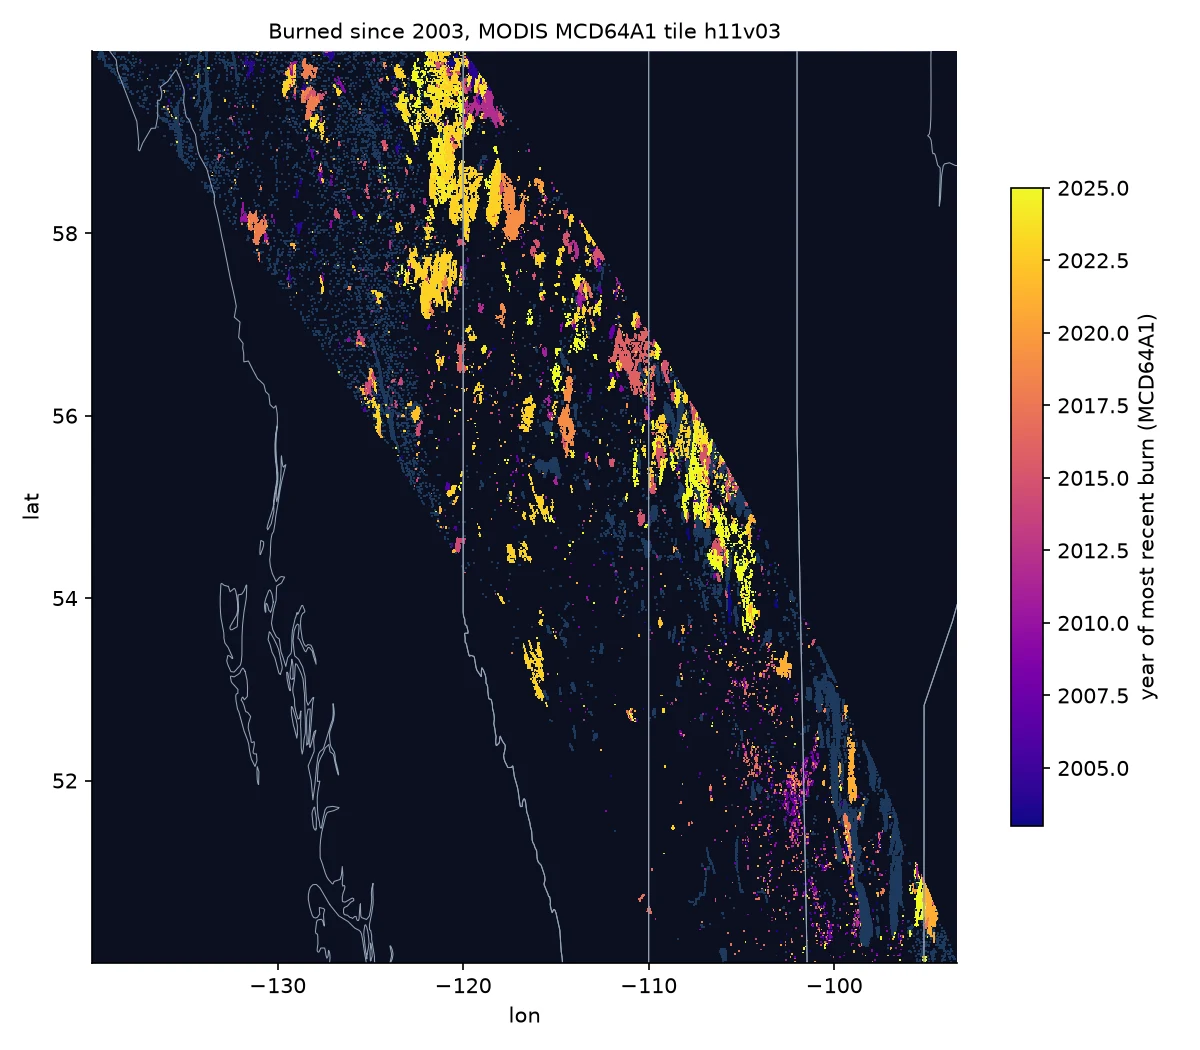
MODIS MCD64A1 burned area for tile h11v03 (the boreal forest of northeastern BC, Alberta and Saskatchewan) shows the ground that actually burned each April–October. 2023 burned 28,262 km², more than double any earlier season in the record.

Across 2003–2025 the Sen's slope is +272 km² a year.

Year each 500 m pixel last burned since 2003 (MCD64A1, tile h11v03).
10,00020,00030,0002003: 1,826 km²2004: 1,990 km²2005: 796 km²20052006: 1,769 km²2007: 812 km²2008: 1,782 km²2009: 1,005 km²2010: 1,496 km²20102011: 1,653 km²2012: 3,401 km²2013: 509 km²2014: 2,259 km²2015: 10,649 km²20152016: 4,355 km²2017: 1,938 km²2018: 4,967 km²2019: 4,920 km²2020: 830 km²20202021: 6,370 km²2022: 1,021 km²2023: 28,262 km²2023: 28,262 km²2024: 10,866 km²2025: 12,560 km²2025
Burned area per April–October season, MCD64A1 tile h11v03, 2003–2025.

03 · How sure we are

Four independent views agree.

MODIS detections over Canada rise by +3,019 a year. The 95% confidence interval runs from +81 to +5,184: wide, but every plausible slope is above zero.

p = 0.035 means that if there were no real trend, a pattern this one-directional would turn up by chance about 3 times in 100. The harmonized count (p = 0.020), fire radiative power (p = 0.011) and MCD64A1 burned area (p = 0.004) all point the same way.

−21,30262,230145,761229,292312,82420052010201520202025+3,019/yr · p = 0.0352003: 45,755 detections2004: 66,873 detections2005: 29,098 detections2006: 30,799 detections2007: 29,260 detections2008: 26,601 detections2009: 25,814 detections2010: 44,923 detections2011: 33,224 detections2012: 34,739 detections2013: 56,234 detections2014: 62,407 detections2015: 64,872 detections2016: 23,525 detections2017: 81,141 detections2018: 56,795 detections2019: 35,686 detections2020: 11,033 detections2021: 83,292 detections2022: 29,337 detections2023: 280,489 detections2024: 127,920 detections2025: 132,777 detections
yearly value Sen's slope 95% CI band · MODIS active-fire detections per year, Canada, 2003–2025
↑ significant rise↓ significant fall– no significant trend

Is fire activity in Canada rising?

All four agree: rising
  • ↑FIRMS harmonized countp = 0.020
  • ↑FIRMS MODIS-only countp = 0.035
  • ↑MODIS fire radiative powerp = 0.011
  • ↑MCD64A1 burned area (one tile)p = 0.004
Mann-Kendall test at α = 0.05 on one value per year. Each row asks one question of several independent NASA records.

04 · The nuance

Where we hold back.

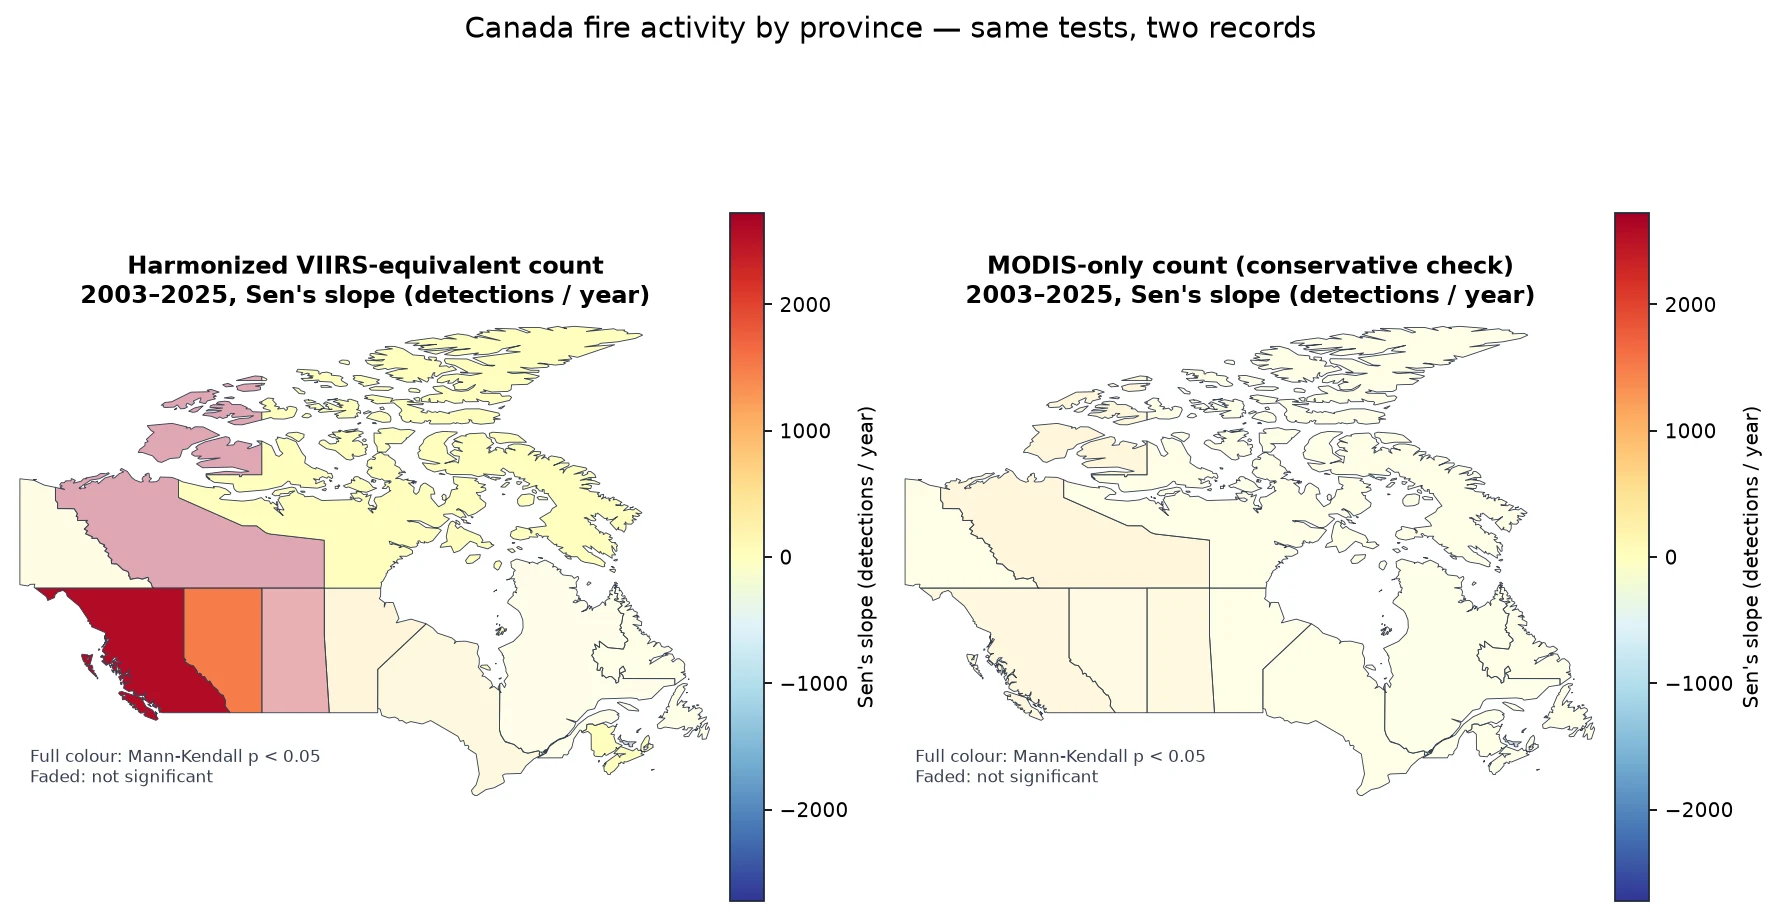
At province level the harmonized series is significant in five provinces but MODIS-only in none. The harmonized record joins a model back-cast (2003–2011) to observed VIIRS (2012 on), so a step at 2012 can pass for a trend. We call those tentative.

MCD64A1 here is one tile, not all of Canada, and the biggest season sits at the end of the record. Monthly-total error for Canada is worse than the baseline (39.4% vs 16.7%), even though per-cell error is better.

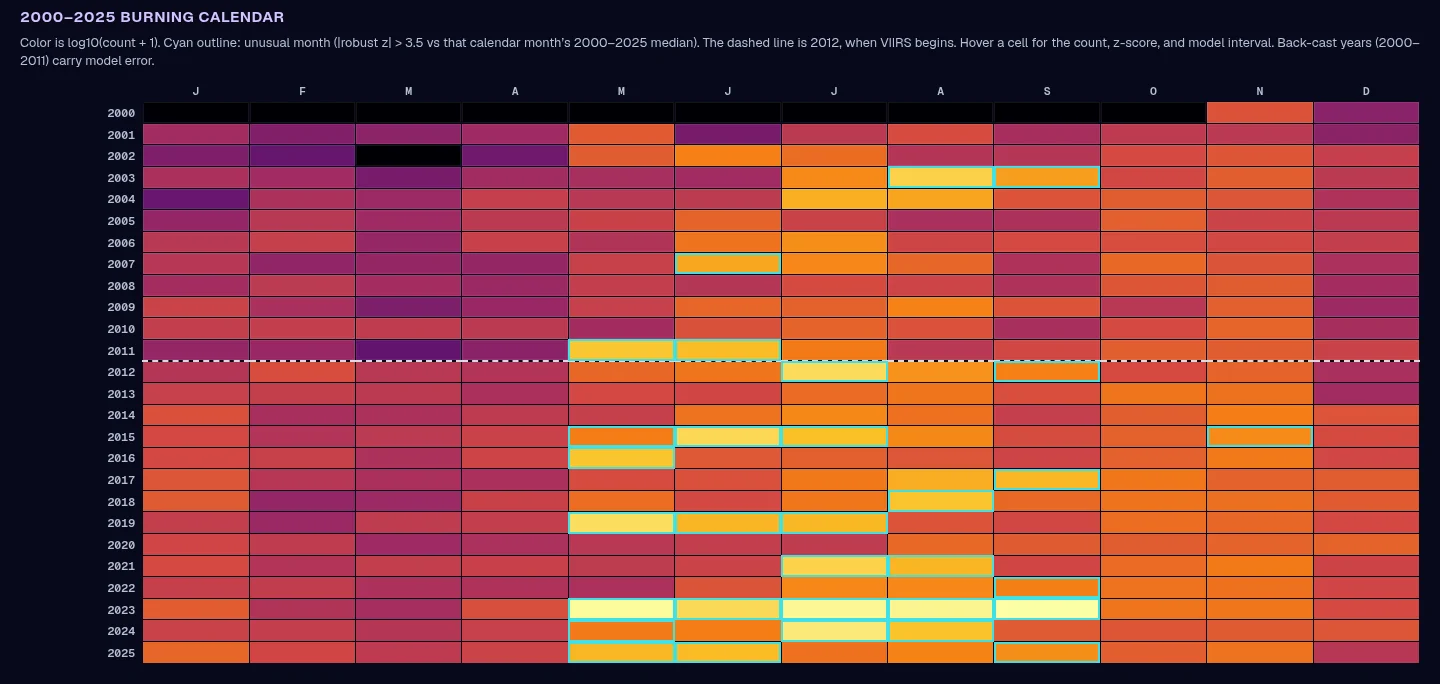
Alberta: harmonized 2000–2025 calendar. The dashed line marks 2012, when VIIRS starts.

05 · Who acts on it

A record that's comparable across 2012.

Fire-management agencies and forest planners compare seasons to set crews, budgets and prevention work. A record that doesn't jump when the sensor changes means a busy season reads as a busy season, not a sensor artefact.

Unusual-month flags and calibrated intervals tell an analyst which months to check first, and how much to trust each number.

Launch the dashboard
What this means

+272 km²more burned ground each year

In northeastern BC, Alberta and Saskatchewan, 2003–2025 (MCD64A1, p = 0.004).

One tile; 95% CI +57 to +503 km² a year.
The harmonized fire calendar for Canada in the live tool: FIRMS detections per 0.25° cell.
Year each 500 m pixel last burned since 2003 (MCD64A1, tile h11v03).
10,00020,00030,0002003: 1,826 km²2004: 1,990 km²2005: 796 km²20052006: 1,769 km²2007: 812 km²2008: 1,782 km²2009: 1,005 km²2010: 1,496 km²20102011: 1,653 km²2012: 3,401 km²2013: 509 km²2014: 2,259 km²2015: 10,649 km²20152016: 4,355 km²2017: 1,938 km²2018: 4,967 km²2019: 4,920 km²2020: 830 km²20202021: 6,370 km²2022: 1,021 km²2023: 28,262 km²2023: 28,262 km²2024: 10,866 km²2025: 12,560 km²2025
Burned area per April–October season, MCD64A1 tile h11v03, 2003–2025.
−21,30262,230145,761229,292312,82420052010201520202025+3,019/yr · p = 0.0352003: 45,755 detections2004: 66,873 detections2005: 29,098 detections2006: 30,799 detections2007: 29,260 detections2008: 26,601 detections2009: 25,814 detections2010: 44,923 detections2011: 33,224 detections2012: 34,739 detections2013: 56,234 detections2014: 62,407 detections2015: 64,872 detections2016: 23,525 detections2017: 81,141 detections2018: 56,795 detections2019: 35,686 detections2020: 11,033 detections2021: 83,292 detections2022: 29,337 detections2023: 280,489 detections2024: 127,920 detections2025: 132,777 detections
yearly value Sen's slope 95% CI band · MODIS active-fire detections per year, Canada, 2003–2025
↑ significant rise↓ significant fall– no significant trend

Is fire activity in Canada rising?

All four agree: rising
  • ↑FIRMS harmonized countp = 0.020
  • ↑FIRMS MODIS-only countp = 0.035
  • ↑MODIS fire radiative powerp = 0.011
  • ↑MCD64A1 burned area (one tile)p = 0.004
Mann-Kendall test at α = 0.05 on one value per year. Each row asks one question of several independent NASA records.
Alberta: harmonized 2000–2025 calendar. The dashed line marks 2012, when VIIRS starts.

What this means

+272 km²more burned ground each year

In northeastern BC, Alberta and Saskatchewan, 2003–2025 (MCD64A1, p = 0.004).

One tile; 95% CI +57 to +503 km² a year.
  1. The signal
  2. What changed
  3. How sure we are
  4. The nuance
  5. Who acts on it

Who uses it

One person, one decision, start to finish.

The path through the dashboard, from the situation they start in to the decision it changes.

Alberta or British Columbia

Provincial fire-management analyst

  1. Before

    2023 was enormous, but they can't say whether their province is in a multi-year rise: VIIRS sees about 5.6× more fire than MODIS since 2012, so 2005 and 2023 aren't in the same units.

  2. Step 1

    Pick the Alberta or B.C. preset, or draw a fire district.

  3. Step 2

    Read the disagreement map and the held-out test card, including the monthly-total miss.

  4. Step 3

    Scroll the 2000–2025 calendar: unusual months outlined, hover for count, z-score and interval; download the CSV.

  5. Step 4

    On the module page, switch the trend between harmonized, MODIS-only and fire radiative power.

  6. Decision

    Brief a national rise on the conservative record (MODIS-only +3,019 detections a year, p = 0.035), but not a provincial trend where MODIS-only isn't significant.

  7. After

    One calendar that can sit next to a 2005 season, a CSV, a known error, and a trend statement no stronger than the conservative test.

Who benefits
Fire managers, and the communities their season plans protect.
Decision it improves
Saying whether fire is really rising, at the right scale, without mistaking the 2012 sensor switch for change.

An illustrative journey built from what the dashboard does today, not a field-tested outcome.

Launch the dashboard

A town or regional district

Community emergency planner

  1. Before

    They need to know whether this month is unusual for their area, in words a mayor can use.

  2. Step 1

    Draw a box around the community.

  3. Step 2

    Read the calendar for that box; a cyan outline marks a month with |z| > 3.5 against its 26-year median.

  4. Step 3

    Hover for the z-score and interval; download the CSV for the briefing pack.

  5. Decision

    Either "this month is flagged unusual against the 2000–2025 median for this box" or "it isn't", with the interval attached.

  6. After

    A single calendar tile and a sentence that is dated, bounded and honest.

Who benefits
Local officials and the residents they brief.
Decision it improves
Deciding whether a month warrants extra readiness, based on the area's own record rather than a national headline.

An illustrative journey built from what the dashboard does today, not a field-tested outcome.

Launch the dashboard
WhatDetect change from orbit

What the module delivers.

  • One harmonized 2000–2025 fire calendar for any area you draw
  • Calibrated uncertainty and unusual-month flags
  • Fire trends per province, checked on a second record
RMSE 0.2844 vs 0.31098.5%

Lower error than the best baseline on Canada's held-out 2022–2025 data (498,302 cell-months).

RMSE 0.5191 vs 0.55306.1%

Lower error than the best baseline in Argentina (193,472 test cell-months). Total-count bias fell from −24.4% to −1.6% after 2021 calibration.

target 90%88.6%

Interval coverage on cells where VIIRS saw fire, Canada. Argentina: 90.1%.

MODIS + VIIRS11616131

FIRMS detections behind the model (Canada and Argentina, 2000–2025).

Argentina: 1422

Unusual months flagged across Canada's 26-year calendar.

baseline 16.7%39.4%

Honest miss: monthly-total error in Canada is worse than the baseline, even though per-cell error is better. Argentina too (16.6% vs 12.2%). Both are shown in the demo.

Held-out test data, compared against baselines. One seed per run, not a published benchmark.

Visuals

Inside the tool

Alberta: 2000–2025 harmonized calendar. Outlined cells are flagged months; the dashed line is 2012, when VIIRS starts.
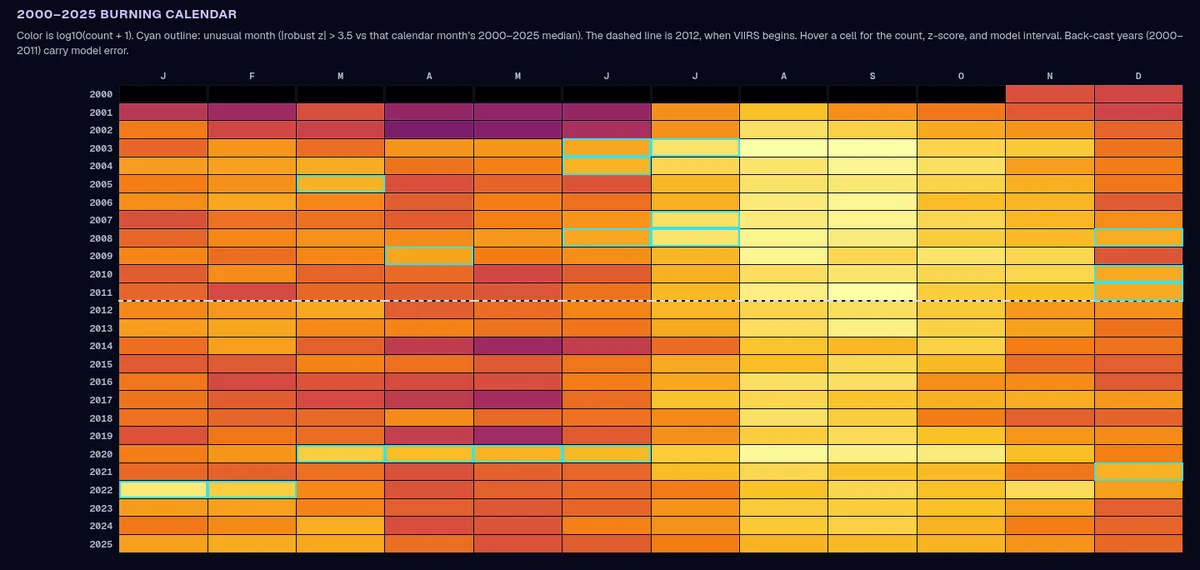
Argentina Chaco preset: a different fire regime, peaking in the austral winter and spring.
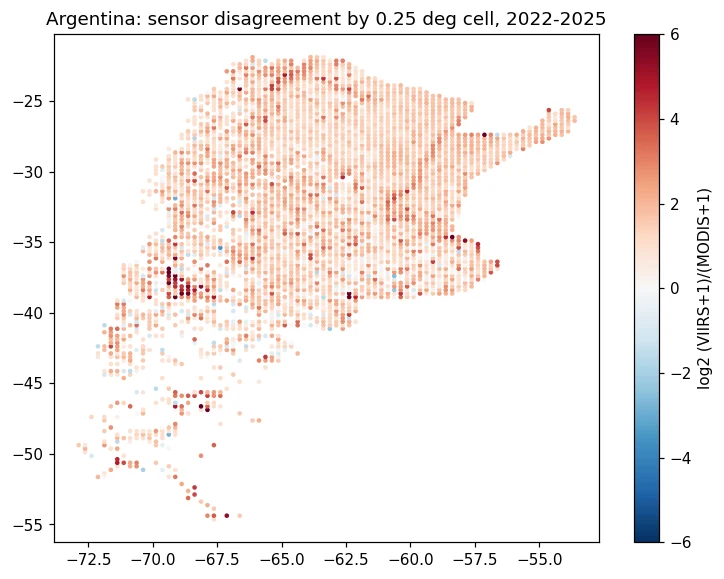
Argentina: where the two sensors disagree most, per 0.25° cell, 2022–2025 (Colab run).

Earthdata upgrade · MODIS MCD64A1

Burned area, mapped and tested

We added the MODIS MCD64A1 burned-area product (500 m, monthly), downloaded with an Earthdata login: 161 monthly files for tile h11v03, which covers the boreal forest of northeastern British Columbia, Alberta and Saskatchewan, about 50–60°N, April to October, 2003–2025. Detections tell you where fire burned at the moment of an overpass; burned area tells you how much ground it took. Summed per season, burned area in this tile rose by about 272 km² a year (Sen's slope, 95% CI +57 to +503; Mann-Kendall p = 0.004, also significant after the Hamed-Rao check). 2023 was the largest season at 28,262 km².

One MODIS tile, not all of Canada. A single huge year (2023) sits at the end of the record, so the slope is sensitive to the last few seasons. Unmapped pixels average 1–3% per season.

Burned area per April–October season, MCD64A1 tile h11v03, 2003–2025.
Year each pixel last burned since 2003, MCD64A1 tile h11v03 (about 50–60°N).

Trend layer · Fire

Is fire activity in Canada increasing?

23 years of NASA FIRMS active fires (2003–2025), summed per province and tested with Mann-Kendall and Sen's slope. Switch between the harmonized record, the single-sensor MODIS record and fire radiative power to see which trends hold up.

  • Canada: rising on every MODIS-era series. Harmonized count +18,497 a year (p = 0.020), MODIS-only +3,019 a year (p = 0.035) and MODIS fire radiative power, summed over all detections, +367 GW a year (p = 0.011). All three are still significant after the autocorrelation correction.
  • Argentina: falling. The same tests give a significant decrease: MODIS-only −1,909 detections a year (p < 0.001), about −32% of a typical year per decade. Same variable, opposite trend in a different place.
  • Provinces: be careful. The harmonized series is significant in Alberta, British Columbia, New Brunswick, Nova Scotia and Nunavut, but MODIS-only is significant in none of them. The harmonized record joins a model back-cast (2003–2011) to observed VIIRS (2012+), so a jump at 2012 can look like a trend. Where only the harmonized series is significant, treat it as tentative.
  • VIIRS alone is too short. With 14 years (2012–2025), no region shows a significant VIIRS-only trend. This is why a harmonized long record matters, and why it needs checking.

Mann-Kendall (α = 0.05) and Sen's slope with 95% CI, one value per year. Hover or tap the chart for yearly values.

Where it is changing

Trend maps

Sen's slope of annual fire detections per province, 2003–2025: harmonized (left) vs MODIS-only (right). Faded provinces are not significant. Harmonized is significant in five provinces; MODIS-only in none, so provincial rises are tentative.
HowApproach, data and limits

The approach

  1. Grid every detection

    NASA FIRMS country archives (MODIS C6.1 and VIIRS S-NPP) for Canada and Argentina, binned into 0.25° cell-months.

  2. Start from an honest baseline

    An empirical-Bayes ratio per cell: how many VIIRS detections each MODIS detection is worth there, shrunk towards the regional ratio.

  3. Learn what the ratio misses

    A LightGBM model corrects the baseline using MODIS fire power, day/night, Aqua/Terra and neighbouring months. Trained 2012–2020, tuned on 2021, tested on 2022–2025.

  4. Say how sure it is

    Conformalized quantile intervals, calibrated per MODIS-count stratum, with a 90% coverage target.

  5. Back-cast and flag

    2000–2011 MODIS is converted to VIIRS scale. Unusual months are flagged with a robust z-score (|z| > 3.5 against that calendar month's 26-year median).

  6. Put it in a browser

    Pick a region or draw any box: the calendar, disagreement map and CSV export are computed client-side from precomputed tiles.

Limits we know about

  • One seed per run; not a published benchmark.
  • Two countries so far (Canada, Argentina). Only VIIRS S-NPP is used, not NOAA-20/21 yet.
  • Intervals are summed over cells in the box; they are not a formal regional confidence interval.
  • Back-cast years (2000–2011) carry model error and are labelled as such.
DatasetHow it's usedAccessLink
NASA FIRMS MODIS Collection 6.1 (MCD14ML)Active fire detections, Terra + Aqua, 2000–2025source
NASA FIRMS VIIRS S-NPP 375 m (VNP14IMG)Active fire detections, 2012–2025source
Esri / OpenStreetMap basemap via LeafletMap context onlysource
NASA FIRMS MODIS + VIIRS (trend layer)Annual detections and FRP per province, 2003–2025; Mann-Kendall + Sen's slopesource
MODIS MCD64A1.061 burned area (module upgrade)Monthly 500 m burned area, tile h11v03, Apr–Oct 2003–2025; Mann-Kendall + Sen's slopesource
Natural Earth admin-1 boundariesProvince outlines for the trend map (public domain)source

For the judges

How it maps to the criteria

Impact

Gives fire managers and researchers a 26-year, single-scale fire calendar for any box on the map, so they can see whether a season is truly unusual.

Creativity

Learns the cross-sensor correction on top of a strong per-cell baseline, rather than one global ratio, and attaches calibrated uncertainty to every back-cast month.

Validity

Strict time split (train 2012–2020, tune 2021, test 2022–2025), four baselines and coverage checks. It reports where it loses (Canada monthly totals) as well as where it wins.

Relevance

Trend Detective: tests 23 years of NASA FIRMS fire activity per province with Mann-Kendall and Sen's slope, and shows why the sensor switch has to be harmonized before you call a trend. Built entirely on NASA FIRMS MODIS and VIIRS records.

Presentation

One-click presets, draw-your-own area, hover details, CSV export and a built-in briefing deck that explains each result in plain language.

First designed around the related Space Apps 2026 brief Harmonization of MODIS and VIIRS Hot Spots; here it is the detect module of one system in Be An Earth System Trend Detective!