Module 03 · Adapt · Be An Earth System Trend Detective!

Field Shift: rotation explorer

Try a crop rotation on your field and see the trade-offs before you plant.

nasa-spaceapps-2026.pages.dev/field-shift/app/Full screen ↗

Interactive and fully static: everything runs in your browser from precomputed data. Use the "Experiment briefing" button inside the tool for a guided walkthrough.

WhyThe problem this module solves

A farmer choosing next year's rotation has to weigh soil, water, erosion and a changing climate, but the satellite evidence for their own field is scattered across agencies and formats.

Farmers face shifting rainfall, heat, frost and declining soil health, and the rotation they pick this year shapes the soil for years.

Field Shift combines NASA Earth observations with local soil, crop and farmer priorities for Story County, Iowa, at the scale of a 1.2 km tile.

The data story · Adapt

From a field's history to next season's plan.

Five beats: the raw signal, what changed, how sure we are, where it gets subtle, and who acts on it.

01 · The signal

Every field, every year, from orbit.

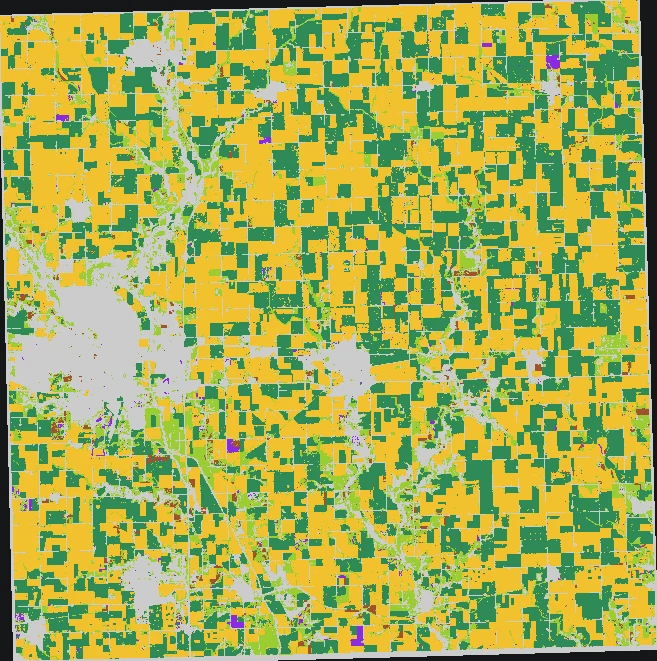
Story County, Iowa, is mostly corn and soybeans. USDA's Cropland Data Layer gives each 30 m field a crop label every year since 2009, and NASA's Harmonized Landsat and Sentinel-2 (HLS) shows how green each field is in mid-summer.

Field Shift learns from that history, plus NASA terrain, climate and NDVI, to predict next season's crop.

Story County crop map from the USDA Cropland Data Layer: corn, soybeans, hay, grass and developed land.

02 · What changed

The growing season is about 19 days longer.

NASA POWER daily temperatures for central Iowa, 1981–2025, show the frost-free season growing by +0.43 days a year. Most of it comes from autumn: the first frost now arrives later (p < 0.001), while the last spring frost hasn't moved (p = 0.48). Corn growing degree days rise too (p < 0.001).

140156172188204198519901995200020052010201520202025+0.43 d/yr · p = 0.0061981: 161 days1982: 176 days1983: 149 days1984: 147 days1985: 172 days1986: 167 days1987: 181 days1988: 160 days1989: 146 days1990: 165 days1991: 153 days1992: 169 days1993: 163 days1994: 175 days1995: 147 days1996: 162 days1997: 153 days1998: 189 days1999: 168 days2000: 168 days2001: 167 days2002: 161 days2003: 172 days2004: 163 days2005: 162 days2006: 172 days2007: 191 days2008: 171 days2009: 173 days2010: 193 days2011: 168 days2012: 174 days2013: 161 days2014: 159 days2015: 175 days2016: 166 days2017: 185 days2018: 169 days2019: 165 days2020: 163 days2021: 182 days2022: 167 days2023: 184 days2024: 183 days2025: 197 days
yearly value Sen's slope 95% CI band · Frost-free season length, central Iowa, 1981–2025

03 · How sure we are

Longer season, steady water.

The 95% confidence interval for the season trend is +0.12 to +0.67 days a year, entirely above zero. p = 0.006: a pattern this strong would turn up by chance about 6 times in 1,000 with no real trend. The Story County cell agrees (p = 0.002).

Water is the other half of the decision. GRACE, GLDAS, SMAP, GPM IMERG and NASA POWER all find no significant trend in Iowa's water, so a longer season isn't coming with less water.

↑ significant rise↓ significant fall– no significant trend

Is Iowa's water changing?

Five records agree: steady
  • –GRACE/GRACE-FO water storagep = 0.57
  • –GLDAS root-zone soil moisturep = 0.35
  • –SMAP surface soil moisturep = 0.21 · 11 seasons
  • –GPM IMERG annual totalp = 0.50
  • –POWER root-zone wetnessp = 0.51

Is Iowa's growing season getting longer?

One source, two scales: longer
  • ↑POWER frost-free days, central Iowap = 0.006
  • ↑POWER frost-free days, Story County cellp = 0.002
  • ↑POWER first autumn frostp < 0.001
Mann-Kendall test at α = 0.05 on one value per year. Each row asks one question of several independent NASA records.

04 · The nuance

What the satellites can't tell apart.

Mid-summer NDVI is near saturation over both corn and soybeans, so HLS shows field-by-field contrast but can't separate crop types. Crop labels come from the Cropland Data Layer, not from HLS. SMAP soil moisture covers only 11 seasons, too short for a strong test.

The crop model is honest about its limits: hay F1 is 0.33, the rare 'other crop' class is 0, and temperature scaling made calibration worse, so the tool keeps the raw probabilities.

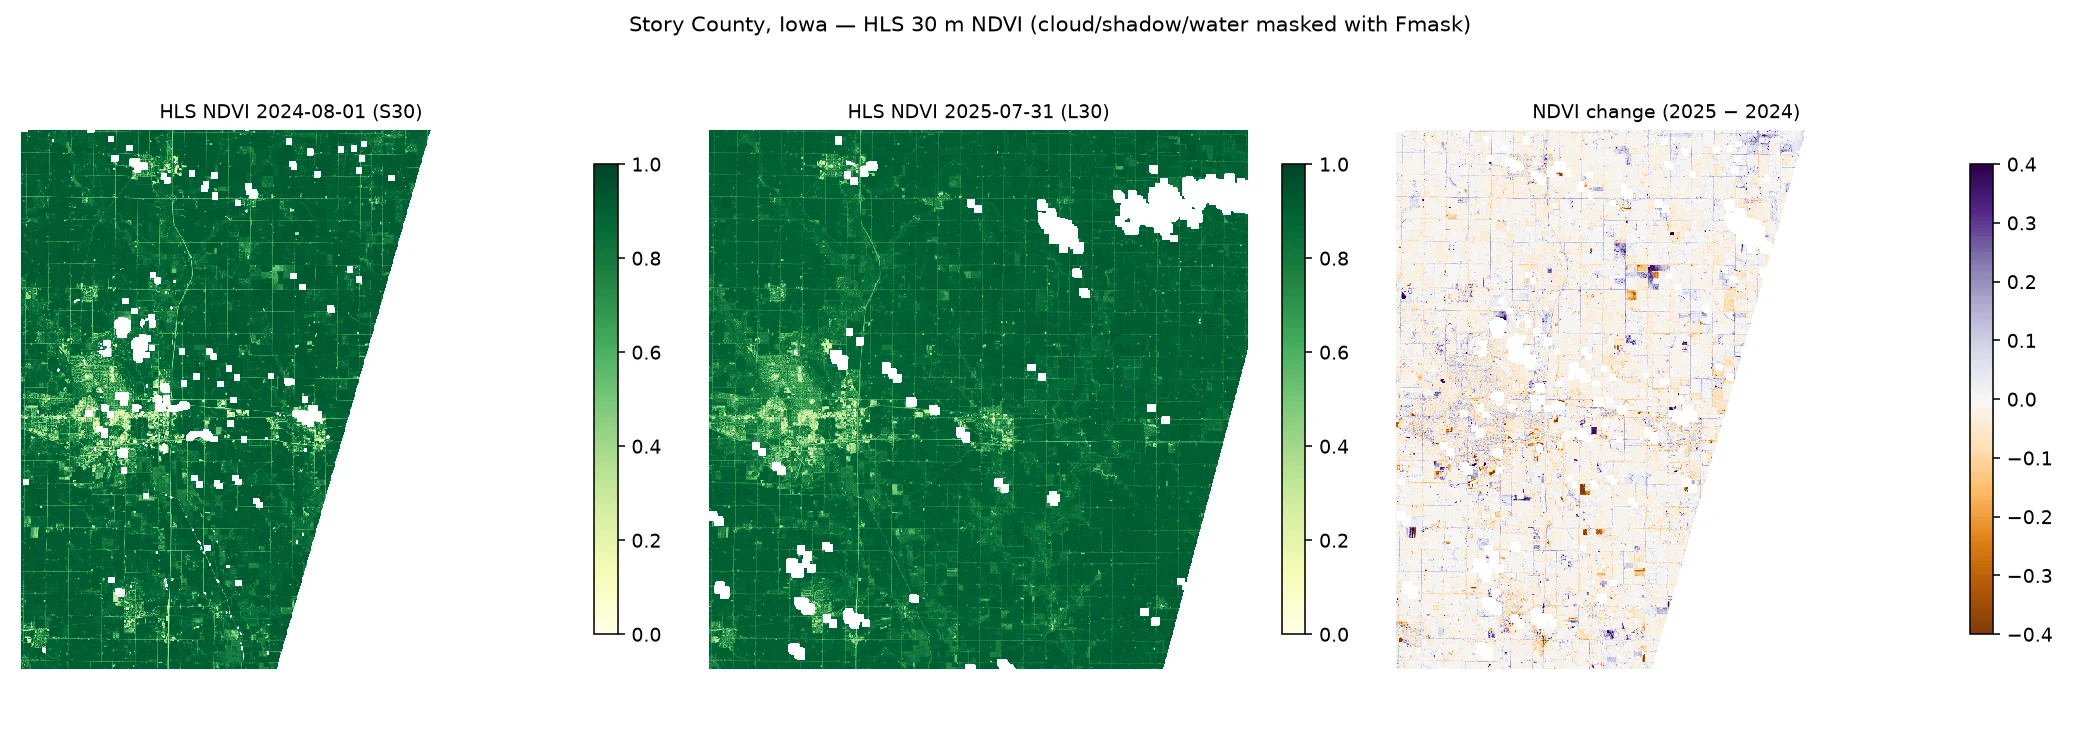
HLS 30 m NDVI, Story County: 1 Aug 2024, 31 Jul 2025 and the change between them.

05 · Who acts on it

Next season's plan, weighed honestly.

A farmer or agronomist decides what to plant next year and how to rotate over four. A later first frost with steady water widens the window after harvest, which favours longer-season hybrids and cover crops: options the rotation explorer lets them test.

It ranks 36 non-dominated four-year plans by the farmer's own weights on five indicators: water demand, erosion risk, nitrogen-fixing share, heat and frost exposure, and soil-moisture stress.

Launch the dashboard
What this means

≈19 dayslonger frost-free season since 1981

Central Iowa, NASA POWER, +0.43 days a year (p = 0.006).

With no significant trend in Iowa's water across five records.
Story County crop map from the USDA Cropland Data Layer: corn, soybeans, hay, grass and developed land.
140156172188204198519901995200020052010201520202025+0.43 d/yr · p = 0.0061981: 161 days1982: 176 days1983: 149 days1984: 147 days1985: 172 days1986: 167 days1987: 181 days1988: 160 days1989: 146 days1990: 165 days1991: 153 days1992: 169 days1993: 163 days1994: 175 days1995: 147 days1996: 162 days1997: 153 days1998: 189 days1999: 168 days2000: 168 days2001: 167 days2002: 161 days2003: 172 days2004: 163 days2005: 162 days2006: 172 days2007: 191 days2008: 171 days2009: 173 days2010: 193 days2011: 168 days2012: 174 days2013: 161 days2014: 159 days2015: 175 days2016: 166 days2017: 185 days2018: 169 days2019: 165 days2020: 163 days2021: 182 days2022: 167 days2023: 184 days2024: 183 days2025: 197 days
yearly value Sen's slope 95% CI band · Frost-free season length, central Iowa, 1981–2025
↑ significant rise↓ significant fall– no significant trend

Is Iowa's water changing?

Five records agree: steady
  • –GRACE/GRACE-FO water storagep = 0.57
  • –GLDAS root-zone soil moisturep = 0.35
  • –SMAP surface soil moisturep = 0.21 · 11 seasons
  • –GPM IMERG annual totalp = 0.50
  • –POWER root-zone wetnessp = 0.51

Is Iowa's growing season getting longer?

One source, two scales: longer
  • ↑POWER frost-free days, central Iowap = 0.006
  • ↑POWER frost-free days, Story County cellp = 0.002
  • ↑POWER first autumn frostp < 0.001
Mann-Kendall test at α = 0.05 on one value per year. Each row asks one question of several independent NASA records.
HLS 30 m NDVI, Story County: 1 Aug 2024, 31 Jul 2025 and the change between them.

What this means

≈19 dayslonger frost-free season since 1981

Central Iowa, NASA POWER, +0.43 days a year (p = 0.006).

With no significant trend in Iowa's water across five records.
  1. The signal
  2. What changed
  3. How sure we are
  4. The nuance
  5. Who acts on it

Who uses it

One person, one decision, start to finish.

The path through the dashboard, from the situation they start in to the decision it changes.

Story County, Iowa

Story County farmer

  1. Before

    They run corn-soy and keep hearing the climate is changing, but don't have their field's history, their priorities and a tested season-length statement in one place.

  2. Step 1

    Click a 1.2 km tile on the 2025 crop map, or pick the county-typical tile.

  3. Step 2

    Move the priority sliders: water demand, erosion risk, nitrogen-fixing share, heat/frost exposure, soil-moisture stress.

  4. Step 3

    Compare current corn-soy with the ranked four-year plans, the trade-off table and the Pareto front.

  5. Step 4

    Read the trend layer: longer, warmer season; no significant water trend.

  6. Decision

    Pick a rotation that uses the longer autumn window (a cover crop after harvest, or a longer-season hybrid) without budgeting for a wetter or drier summer.

  7. After

    A shortlist scored to their own weights, a tested climate statement, and a reminder to check it with a local agronomist.

Who benefits
The farm, and the soil and water it depends on.
Decision it improves
Choosing next season's rotation with the trade-offs visible, instead of repeating last year by default.

An illustrative journey built from what the dashboard does today, not a field-tested outcome.

Launch the dashboard

Advising several Iowa farms

Agronomist or crop advisor

  1. Before

    They won't recommend a tool they can't audit; they need to know where the model is weak and which climate claims hold up.

  2. Step 1

    Plan a rotation on a tile, as the farmer would.

  3. Step 2

    Open "How we scored it" and "Model honesty": baselines, ablation, the calibration miss, the 2025 disagreement map.

  4. Step 3

    Read the HLS and SMAP caveats and the crop and water trends.

  5. Decision

    Use the tool to talk through season length and trade-offs, and override it on hay, rare crop classes and any soil-moisture trend claim.

  6. After

    They can point at a tile and say what is tested, what is a weighted score, and what still needs a field walk.

Who benefits
The farmers they advise.
Decision it improves
Giving advice that separates tested trends from model guesses.

An illustrative journey built from what the dashboard does today, not a field-tested outcome.

Launch the dashboard
WhatAdapt on the ground

What the module delivers.

  • Next-season crop prediction from 2009–2025 crop maps plus NASA terrain, climate and NDVI
  • 36 rotation plans ranked by the farmer's own priorities
  • Growing-season trends: longer frost-free season, more heat, steady soil water
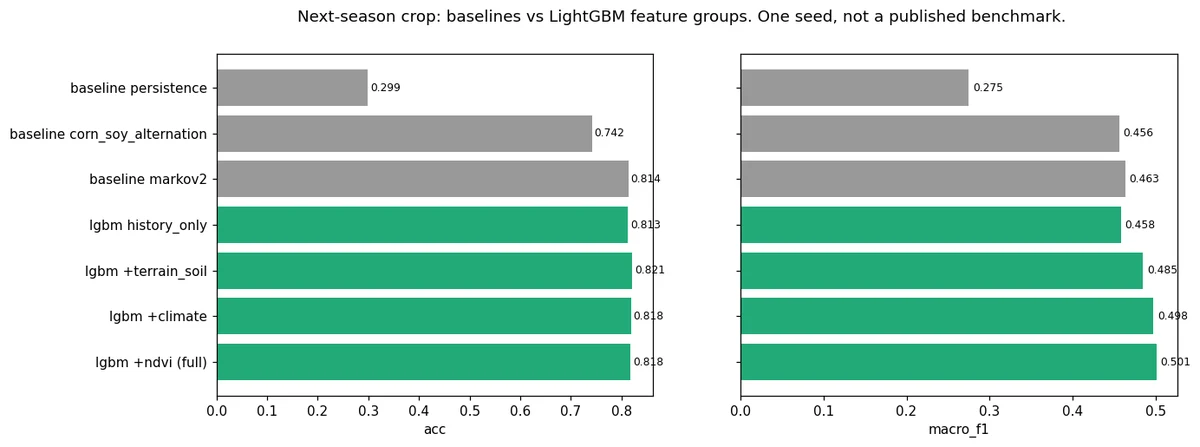
Markov-2: 0.81360.8176

Next-season crop accuracy on 66,666 held-out pixels (2024–2025).

Markov-2: 0.46330.5012

Macro-F1 across six crop classes. Adding NASA terrain, soil, climate and NDVI to crop history lifts it from 0.4582.

1,495,561 pixels0.811

Pixel accuracy of the full-county 2025 map.

water demand +13%−67%

Erosion-risk index of a cover-crop rotation vs the current corn-soy rotation (county-typical field).

NASA POWER, 2015–2024553 mm

Median growing-season rainfall used in the climate panel.

raw: 0.0160.0351

Honest miss: temperature scaling made calibration worse (ECE), so the tool keeps the raw probabilities. Hay F1 is 0.33 and the rare 'other crop' class is 0.

Held-out test data, compared against baselines. One seed per run, not a published benchmark.

Visuals

Inside the tool

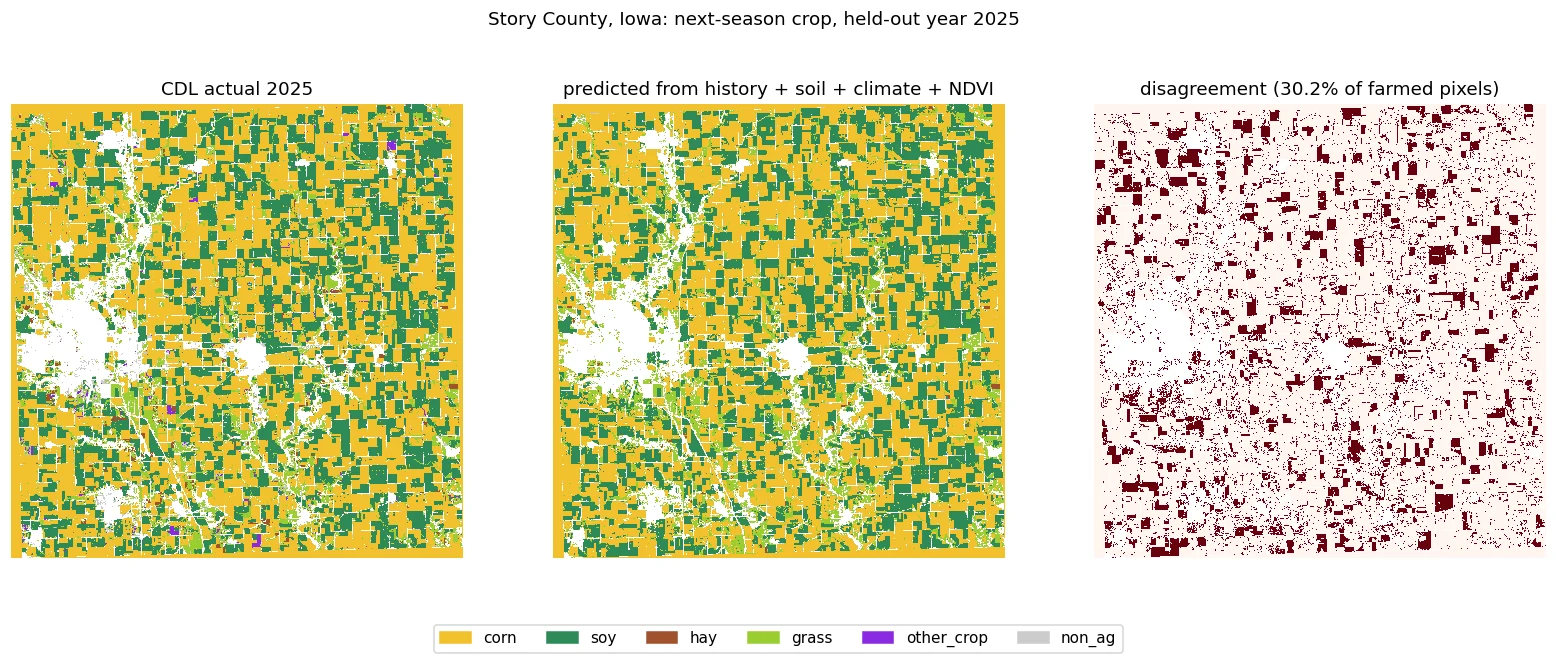
Held-out 2025: the actual crop map, the model's prediction and where they disagree.
What each data layer adds (Colab full-county run).
Story County crop groups from the Cropland Data Layer.

Earthdata upgrade · NASA HLS

Field by field at 30 m

We added NASA's Harmonized Landsat and Sentinel-2 (HLS v2.0, 30 m), downloaded with an Earthdata login, for Story County, Iowa (tile T15TVG). Comparing clear mid-summer scenes on 1 August 2024 (Sentinel-2) and 31 July 2025 (Landsat) over 866 km² of vegetated land, the median NDVI change is −0.01; 42 km² got greener by more than 0.1 and 22 km² got less green by more than 0.1.

Two single dates from two sensors in two years. Mid-summer NDVI is near saturation over both corn and soybeans, so HLS here can't separate crop types: it shows field-by-field contrast, not a crop map or a trend. The 2024 Sentinel-2 scene covers only about 60% of the county. We also processed SMAP enhanced L3 surface soil moisture (9 km, Earthdata login, 1,602 daily files): May–September means of 0.16 to 0.22 m³/m³ in Story County over 2015–2025, with no significant trend (p = 0.47; central Iowa p = 0.21). Eleven seasons is a short record.

HLS 30 m NDVI, Story County: 1 Aug 2024, 31 Jul 2025 and the change between them (cloud, shadow and water masked).

Trend layer · Crops

Is the growing season in Iowa changing?

Rotation choices depend on season length, heat and soil water. We built seven growing-season indicators from 45 years (1981–2025) of NASA POWER daily data for central Iowa and the Story County cell where Field Shift runs, and tested each for a trend.

  • A longer frost-free season. +0.43 days a year across central Iowa (p = 0.006); +0.47 in the Story County cell (p = 0.002). On the Sen trend line that's about 19 days longer between 1981 and 2025.
  • Autumn is driving it. The first autumn frost is getting later by about 0.4 days a year (p < 0.001, all 35 cells significant). The last spring frost shows no significant change (p = 0.48).
  • More heat for corn. May–Sep growing degree days rise by about 4.6 a year (p < 0.001, all 35 cells), roughly +3% of a typical season per decade.
  • Water underground is steady. Three independent records agree there's no significant trend in Iowa's water: GRACE/GRACE-FO total water storage, 2003–2025 (p = 0.57); GLDAS Noah land-model soil moisture at every depth to 1 m, May–September 2000–2025 (p = 0.27 to 0.38); and SMAP satellite surface soil moisture, 2015–2025 (p = 0.21, a short record with low power). GPM IMERG annual rain shows no trend either (p = 0.50).
  • No change in summer water. Root-zone wetness (p = 0.51), May–Sep rain (p = 0.55) and hot days ≥ 32 °C (p = 0.41) show no significant trend. A longer, warmer season with the same water favours longer-season hybrids and cover crops after harvest, which is what the rotation explorer lets you test.

Mann-Kendall (α = 0.05) and Sen's slope with 95% CI, one value per year. Hover or tap the chart for yearly values.

Where it is changing

Trend maps

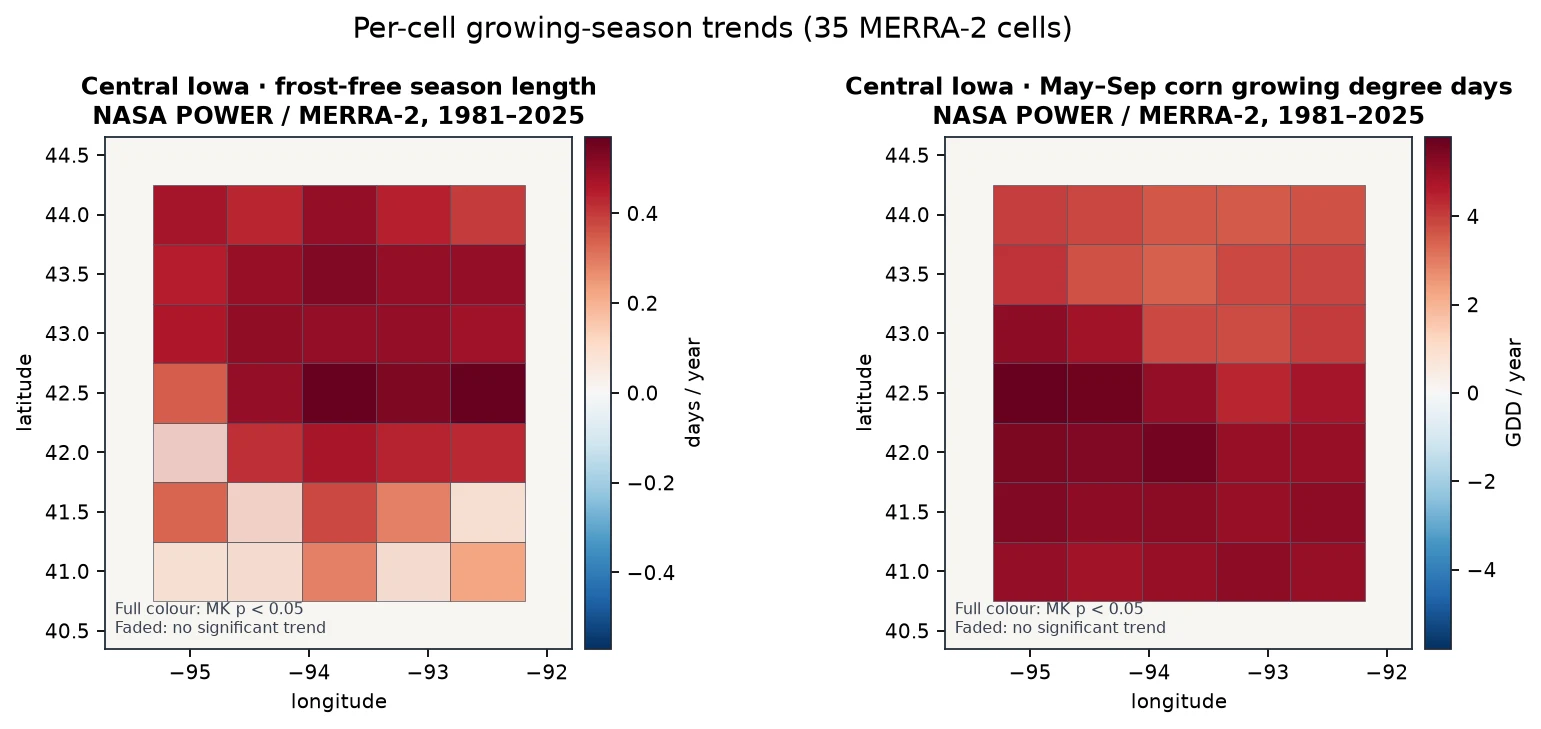
Per-cell trends across central Iowa, 1981–2025: frost-free season (29 of 35 cells significantly longer) and May–September growing degree days (35 of 35 rising).
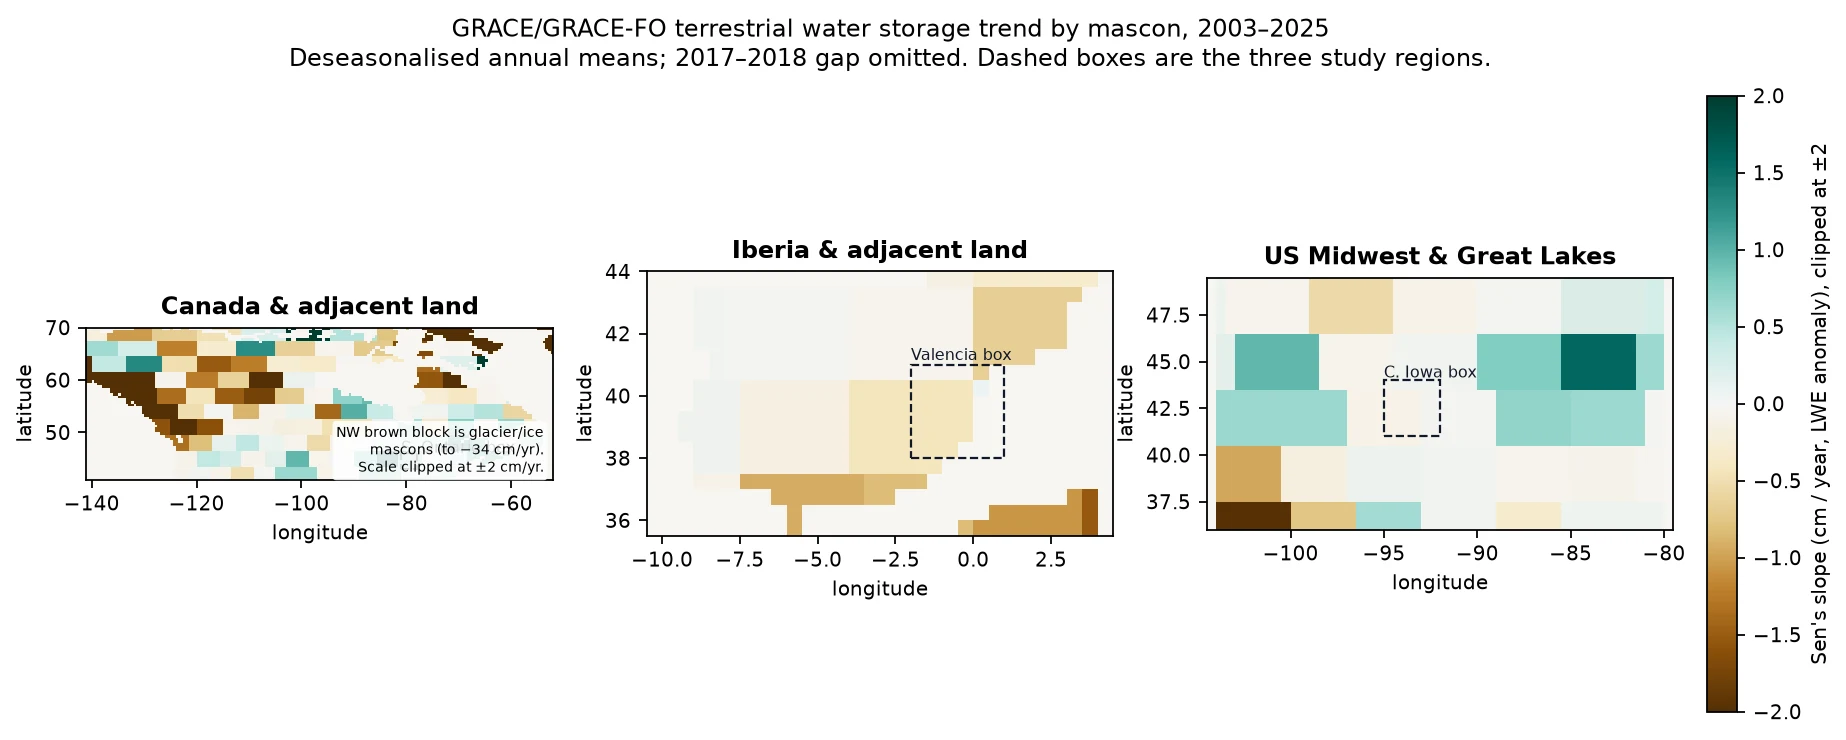
GRACE/GRACE-FO mascon trends, 2003–2025. The Iowa box sits in the flat zone, consistent with no significant water-storage trend (p = 0.57).
HowApproach, data and limits

The approach

  1. Read the field's history

    USDA Cropland Data Layer 2009–2025 at 30 m, grouped into 923 analysis tiles of 1.2 km.

  2. Add NASA context

    NASADEM slope, NASA POWER climate (growing-degree days, frost, heat, rainfall, root-zone wetness), MODIS NDVI bare-soil months and SoilGrids texture and carbon.

  3. Predict next season

    LightGBM predicts each pixel's next crop from five years of history plus terrain, soil, climate and NDVI. Trained to 2021, tuned on 2022–2023, tested on 2024–2025.

  4. Score the trade-offs

    Five indicators per rotation: water demand (FAO-56 crop coefficients), erosion risk, nitrogen-fixing share, heat/frost exposure and soil-moisture stress.

  5. Search for better plans

    Three reference rotations plus an NSGA-II search (48 individuals, 25 generations) that finds 36 non-dominated four-year plans. Sliders re-rank them by the farmer's own priorities.

Limits we know about

  • One seed per run; not a published benchmark. One county so far.
  • Indicators are planning scores, not yield or evapotranspiration forecasts. Markets, leases and equipment aren't modelled.
  • Cover crops aren't a CDL class; their effect on bare months is a documented assumption.
  • SMAP, ECOSTRESS, GPM IMERG and GRACE aren't integrated yet (they need an Earthdata login).
  • The tool supports farmer judgment and local agronomy; it doesn't replace them.
DatasetHow it's usedAccessLink
NASA POWERDaily climate 2000–2024: temperature, rainfall, root-zone wetnesssource
NASADEMElevation and slope (NASA JPL / LP DAAC)source
MODIS MOD13Q1 NDVI16-day vegetation index; bare-soil monthssource
USDA NASS Cropland Data Layer30 m crop maps 2009–2025 (public domain)source
ISRIC SoilGridsClay, sand, organic carbon, pH, bulk density (CC-BY-4.0)source
NASA POWER daily T2M_MIN, T2M_MAX, GWETROOT, PRECTOTCORR (trend layer)1981–2025 growing-season indicators, central Iowa (35 cells) and Story County; Mann-Kendall + Sen's slopesource
GRACE/GRACE-FO JPL mascon RL06.3 CRI v04 (trend layer)Monthly total water storage 2002–2026, land cells over central Iowa; deseasonalised annual meanssource
NASA HLS v2.0 HLSL30 + HLSS30 (module upgrade)30 m NDVI, Story County, two mid-summer scenes (1 Aug 2024, 31 Jul 2025)source
NASA SMAP L3 enhanced soil moisture SPL3SMP_E (module upgrade)9 km surface soil moisture, Story County and central Iowa, May–Sep means 2015–2025; Mann-Kendall + Sen's slopesource
GLDAS Noah 2.1 monthly GLDAS_NOAH025_M (trend layer)Soil moisture at four depths to 1 m, central Iowa, May–Sep means 2000–2025source
GPM IMERG V07 monthly GPM_3IMERGM (trend layer)Satellite rainfall, 0.1°, central Iowa box, annual totals 1998–2024source

For the judges

How it maps to the criteria

Impact

Helps farmers and advisers compare rotations on soil, water and climate risk, field by field, before committing a season.

Creativity

Combines a next-season crop model with a multi-objective search, so farmers explore a trade-off frontier instead of getting one 'best' answer.

Validity

Temporal split, three baselines, ablation by data layer, calibration checks and per-class scores, including the classes it gets wrong.

Relevance

Trend Detective: 45 years of NASA POWER show central Iowa's frost-free season and growing degree days rising significantly, which changes the rotation question. NASA POWER, NASADEM and MODIS NDVI drive the indicators and the model.

Presentation

Click a tile, move five priority sliders and watch the ranked rotations update, with a plain-language note on each plan's benefits and risks.

First designed around the related Space Apps 2026 brief Field Shift: Adapting Farms with NASA Data; here it is the adapt module of one system in Be An Earth System Trend Detective!