NASA Space Apps 2026 · Be An Earth System Trend Detective!

Orbit to Ground

An Earth-change intelligence pipeline, from orbit to decision. Three working modules turn NASA satellite data into decisions: detect, confirm, adapt. Each one answers what is changing, where, how much, and whether it's significant.

Demo · under 30 s The three modules and the trend layer in one pass. Download MP4 · Captions · Slides (PDF)
Why01 · The problem

Change is fast. The evidence is split.

Three recent events, each seen from orbit, each with a decision that came too late or without the full record.

Satellites already see these changes, but the evidence rarely reaches a decision intact. Fire records are split across sensors, so long trends can't be trusted. Optical satellites go blind under the storm clouds that cause floods. And the people choosing what to plant next year rarely get the land's history in a usable form. A single dramatic image can't tell anyone whether something is a trend.

What · 02 · The system

Three modules, one pipeline.

  1. 01DetectHot Spots Harmonizer

    Fire managers can't compare a 2005 fire season with a 2023 one, because NASA's fire record switches sensors in 2012 and VIIRS sees about 5.6 times more fire than MODIS. Without one consistent record, no one can say if fire is really increasing.

    8.5% · lower error than the best baseline on 2022–2025 Canada test data
  2. 02ConfirmSAR Change

    During a flood the sky is covered, so optical satellites see cloud, not water. Radar sees through it day and night, but responders and the public can't read radar images, and one flood map can't say if floods are a trend.

    3.0× · the water overlap of the standard Otsu threshold on hand-labelled flood chips
  3. 03AdaptField Shift

    A farmer choosing next year's rotation has to weigh soil, water, erosion and a changing climate, but the satellite evidence for their own field is scattered across agencies and formats.

    0.8176 · next-season crop accuracy on 66,666 held-out pixels (macro-F1 0.5012)
  4. 04MeasureTrend layer

    Every module answers the same four questions: what is changing, where, by how much, and is it significant? Mann-Kendall and Sen's slope on 23 to 45 years of NASA records.

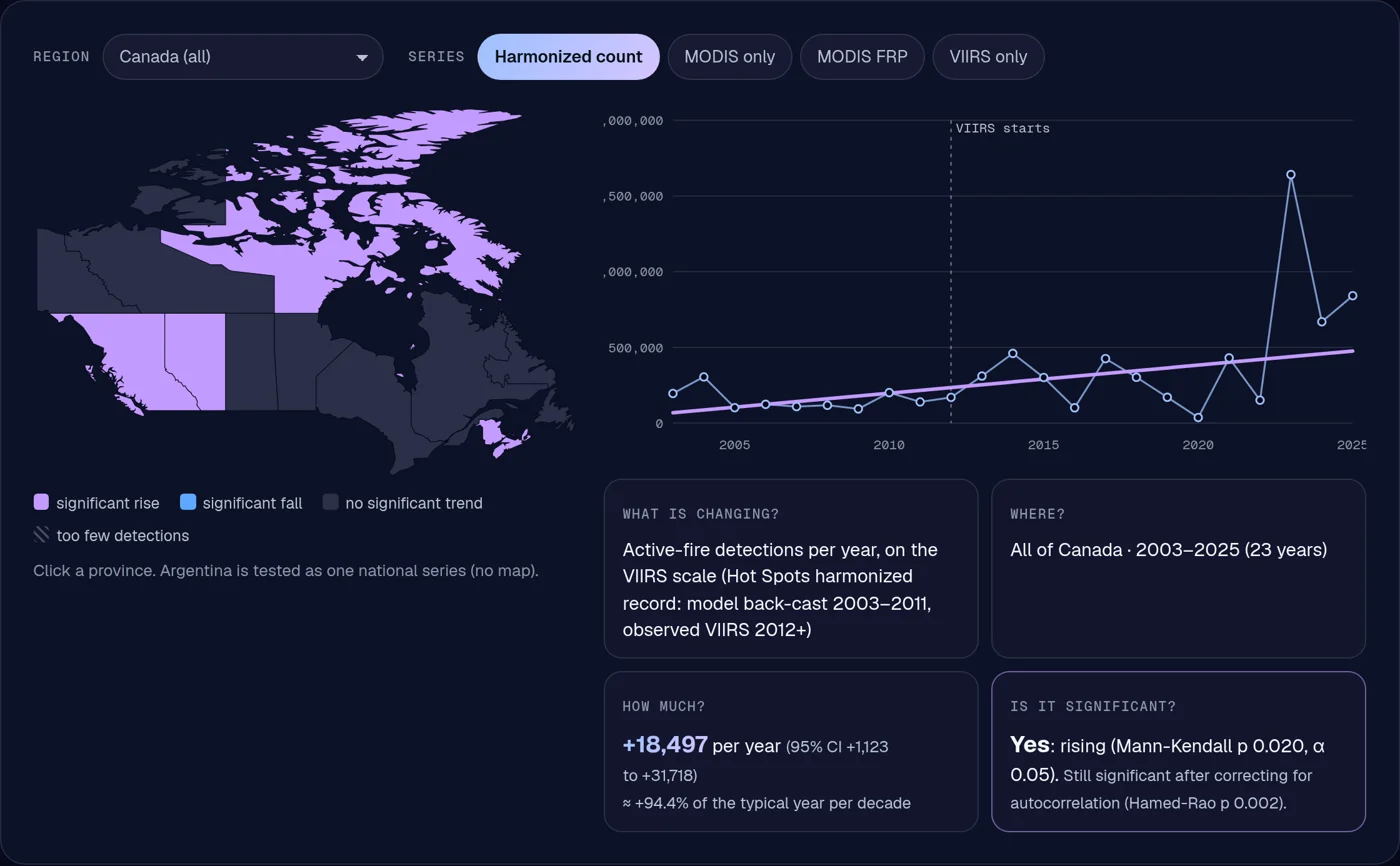
    Canada fire +3,019 detections/yr (p = 0.035) · Iowa frost-free +0.43 d/yr (p = 0.006)
Hot Spots HarmonizerSAR ChangeField ShiftTrend layer

01 · Detect

What · 02 · The system

Three modules, one pipeline.

Hot Spots Harmonizer

01 · Detect

Hot Spots Harmonizer

Fire managers can't compare a 2005 fire season with a 2023 one, because NASA's fire record switches sensors in 2012 and VIIRS sees about 5.6 times more fire than MODIS. Without one consistent record, no one can say if fire is really increasing.

8.5% · lower error than the best baseline on 2022–2025 Canada test data

SAR Change

02 · Confirm

SAR Change

During a flood the sky is covered, so optical satellites see cloud, not water. Radar sees through it day and night, but responders and the public can't read radar images, and one flood map can't say if floods are a trend.

3.0× · the water overlap of the standard Otsu threshold on hand-labelled flood chips

Field Shift

03 · Adapt

Field Shift

A farmer choosing next year's rotation has to weigh soil, water, erosion and a changing climate, but the satellite evidence for their own field is scattered across agencies and formats.

0.8176 · next-season crop accuracy on 66,666 held-out pixels (macro-F1 0.5012)

Trend layer

04 · Measure

Trend layer

Every module answers the same four questions: what is changing, where, by how much, and is it significant? Mann-Kendall and Sen's slope on 23 to 45 years of NASA records.

Canada fire +3,019 detections/yr (p = 0.035) · Iowa frost-free +0.43 d/yr (p = 0.006)

What · the modules

Each module is a full, working tool.

Open any module for its live demo, results, figures and data. Every tool runs in your browser from precomputed NASA data.

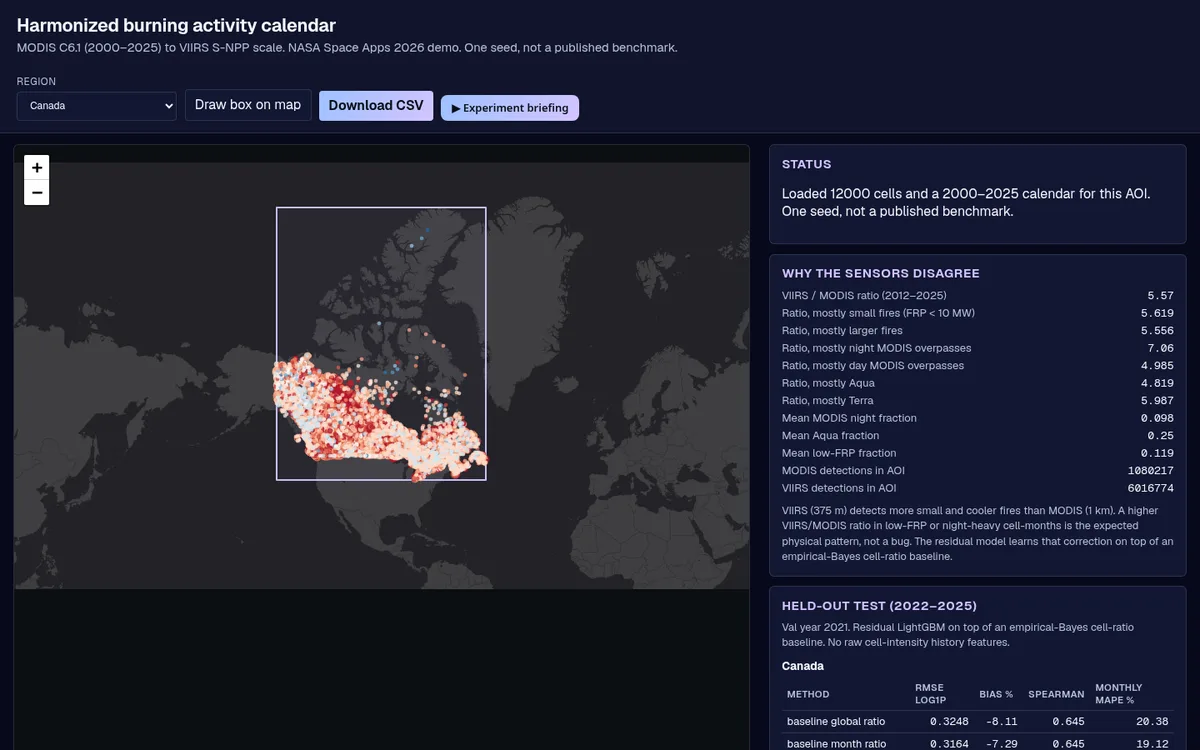
Hot Spots Harmonizer screenshot
Module 01 · Detect

Hot Spots Harmonizer

The problem. Fire managers can't compare a 2005 fire season with a 2023 one, because NASA's fire record switches sensors in 2012 and VIIRS sees about 5.6 times more fire than MODIS. Without one consistent record, no one can say if fire is really increasing.

  • One harmonized 2000–2025 fire calendar for any area you draw
  • Calibrated uncertainty and unusual-month flags
  • Fire trends per province, checked on a second record
8.5%lower error than the best baseline on 2022–2025 Canada test data
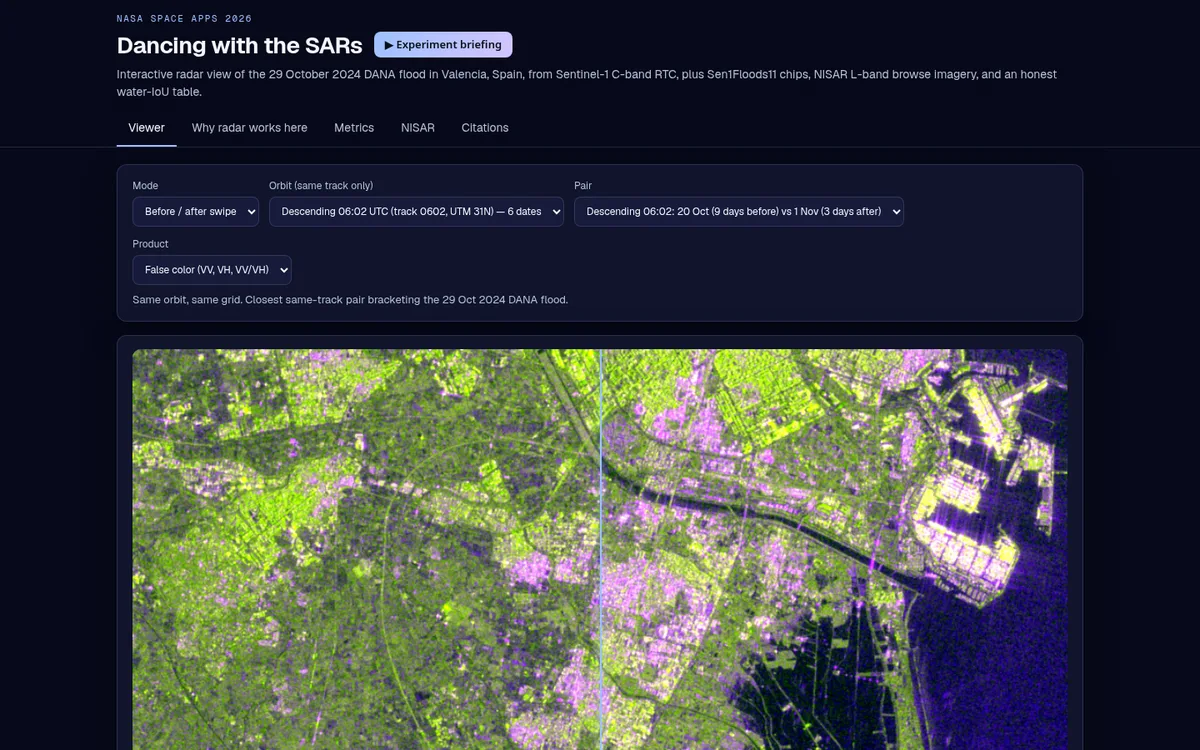
SAR Change: Valencia flood viewer screenshot
Module 02 · Confirm

SAR Change: Valencia flood viewer

The problem. During a flood the sky is covered, so optical satellites see cloud, not water. Radar sees through it day and night, but responders and the public can't read radar images, and one flood map can't say if floods are a trend.

  • Radar before/after and time-lapse of the Valencia flood
  • A water model that triples the standard threshold's overlap
  • NASA OPERA radar water maps and NISAR granules, plus 45-year rain and 23-year water-storage trends
3.0×the water overlap of the standard Otsu threshold on hand-labelled flood chips
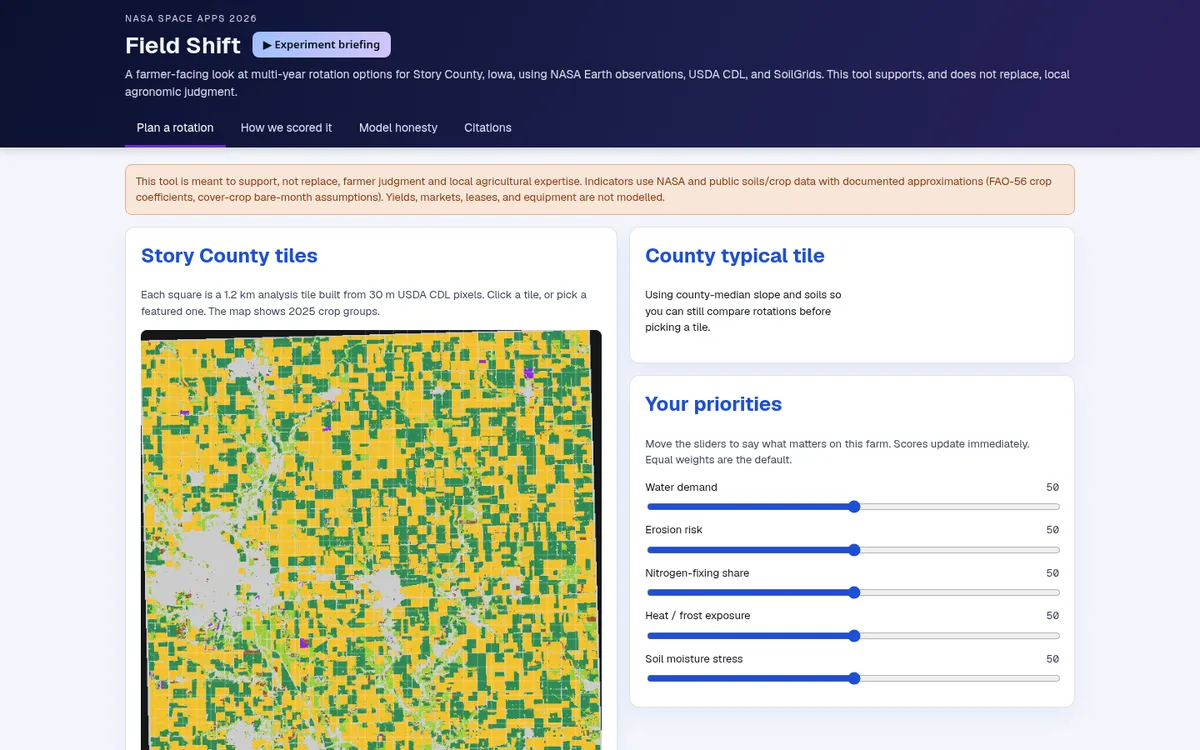
Field Shift: rotation explorer screenshot
Module 03 · Adapt

Field Shift: rotation explorer

The problem. A farmer choosing next year's rotation has to weigh soil, water, erosion and a changing climate, but the satellite evidence for their own field is scattered across agencies and formats.

  • Next-season crop prediction from 2009–2025 crop maps plus NASA terrain, climate and NDVI
  • 36 rotation plans ranked by the farmer's own priorities
  • Growing-season trends: longer frost-free season, more heat, steady soil water
0.8176next-season crop accuracy on 66,666 held-out pixels (macro-F1 0.5012)
How03 · Data, methods, validation

Built on NASA data. Tested before trusted.

Every number comes from our own runs on the public datasets below. Model metrics are one seed each, not a published benchmark.

DatasetModuleHow it's usedAccess
NASA FIRMS MODIS Collection 6.1 (MCD14ML)DetectActive fire detections, Terra + Aqua, 2000–2025
NASA FIRMS VIIRS S-NPP 375 m (VNP14IMG)DetectActive fire detections, 2012–2025
NASA FIRMS MODIS + VIIRS (trend layer)DetectAnnual detections and FRP per province, 2003–2025; Mann-Kendall + Sen's slope
MODIS MCD64A1.061 burned area (module upgrade)DetectMonthly 500 m burned area, tile h11v03, Apr–Oct 2003–2025; Mann-Kendall + Sen's slope
Natural Earth admin-1 boundariesDetectProvince outlines for the trend map (public domain)
NASA-ISRO NISAR L2 GCOV (metadata + browse)ConfirmGranule search via NASA CMR; public browse images from ASF DAAC
Sentinel-1 RTC (ESA Copernicus)ConfirmVV/VH backscatter, 10 m, Valencia, Sept–Dec 2024; RTC via Microsoft Planetary Computer
Sen1Floods11 (CC-BY-4.0)ConfirmHand-labelled Sentinel-1 flood chips (Bonafilia et al., 2020)
JRC Global Surface WaterConfirmPermanent-water reference overlay on the test chips
NASA POWER daily PRECTOTCORR (trend layer)ConfirmDaily precipitation 1981–2025 (MERRA-2 based), 35 cells per region; Mann-Kendall + Sen's slope
GRACE/GRACE-FO JPL mascon RL06.3 CRI v04 (trend layer)ConfirmMonthly total water storage 2002–2026, land cells over eastern Spain and southern Ontario; deseasonalised annual means
GPM IMERG V07 monthly GPM_3IMERGM (trend layer)ConfirmSatellite rainfall, 0.1°, eastern Spain and southern Ontario boxes, 1998–2024: annual, Sep–Nov and wettest-month totals
NASA/JPL OPERA DSWx-S1 (module upgrade)ConfirmRadar-derived surface water, 30 m, 18 passes 1 Oct–19 Nov 2024 over the Valencia flood zone
NASA POWERAdaptDaily climate 2000–2024: temperature, rainfall, root-zone wetness
NASADEMAdaptElevation and slope (NASA JPL / LP DAAC)
MODIS MOD13Q1 NDVIAdapt16-day vegetation index; bare-soil months
USDA NASS Cropland Data LayerAdapt30 m crop maps 2009–2025 (public domain)
ISRIC SoilGridsAdaptClay, sand, organic carbon, pH, bulk density (CC-BY-4.0)
NASA POWER daily T2M_MIN, T2M_MAX, GWETROOT, PRECTOTCORR (trend layer)Adapt1981–2025 growing-season indicators, central Iowa (35 cells) and Story County; Mann-Kendall + Sen's slope
NASA HLS v2.0 HLSL30 + HLSS30 (module upgrade)Adapt30 m NDVI, Story County, two mid-summer scenes (1 Aug 2024, 31 Jul 2025)
NASA SMAP L3 enhanced soil moisture SPL3SMP_E (module upgrade)Adapt9 km surface soil moisture, Story County and central Iowa, May–Sep means 2015–2025; Mann-Kendall + Sen's slope
GLDAS Noah 2.1 monthly GLDAS_NOAH025_M (trend layer)AdaptSoil moisture at four depths to 1 m, central Iowa, May–Sep means 2000–2025

Methods

  1. Detect. Empirical-Bayes per-cell VIIRS/MODIS ratio, corrected by LightGBM; conformal intervals at a 90% target; robust z-score flags (|z| > 3.5); MODIS MCD64A1 burned area as a second, area-based record.

  2. Confirm. Sentinel-1 RTC stacks per orbit; U-Net trained on Sen1Floods11 (14 Optuna trials) against Otsu and a global threshold; OPERA DSWx-S1 water counted outside usual water.

  3. Adapt. LightGBM next-season crop model on CDL history plus NASADEM, POWER, NDVI and SoilGrids; FAO-56 water demand; NSGA-II search over four-year rotations; HLS 30 m NDVI and SMAP soil moisture for field-level context.

  4. Measure. One value per year; Mann-Kendall (two-sided, α = 0.05) and Sen's slope with a 95% CI; Hamed-Rao autocorrelation check; a second series wherever one exists (GRACE/GRACE-FO water storage, GPM IMERG rainfall, GLDAS and SMAP soil moisture).

Validation and limits

What holds up

Models are trained on earlier years and tested on later ones (fire 2022–2025, crops 2024–2025) and beat simple baselines. Trends are tested on a second series where one exists.

Where it falls short

Canada's monthly-total fire error is worse than the baseline (39.4% vs 16.7%). Province fire trends hold on the harmonized record but not MODIS alone, so we call them tentative. Trends show change, not cause. Where a second record disagrees, we say so: GPM IMERG satellite rainfall doesn't confirm the reanalysis drop in southern Ontario's rain extremes, so that claim is dropped.

For the judges

Scored on five criteria.

One submission to Be An Earth System Trend Detective!, team GeoAI Toronto. Each module page maps its work to the 2026 criteria.

01

Impact

Addresses a real problem, and how many people it could help.

02

Creativity

Original idea, or a meaningful improvement on existing ones.

03

Validity

Scientifically grounded, technically feasible and usable.

04

Relevance

Answers the challenge directly, with NASA data as a core part.

05

Presentation

Clear, engaging story of the challenge, the solution and why it matters.