Module 02 · Confirm · Be An Earth System Trend Detective!

SAR Change: Valencia flood viewer

Radar sees the flood through the clouds. This viewer makes it readable.

nasa-spaceapps-2026.pages.dev/sar-change/app/Full screen ↗

Interactive and fully static: everything runs in your browser from precomputed data. Use the "Experiment briefing" button inside the tool for a guided walkthrough.

WhyThe problem this module solves

During a flood the sky is covered, so optical satellites see cloud, not water. Radar sees through it day and night, but responders and the public can't read radar images, and one flood map can't say if floods are a trend.

Floods arrive with the storm, so optical satellites usually see only cloud. Synthetic aperture radar sees through cloud, day or night, but radar images are hard to read for anyone who isn't a specialist.

SAR Change takes the 29 October 2024 DANA flood in Valencia, Spain, and makes the radar change visible and explainable, with a path to NISAR L-band.

The data story · Confirm

Seeing a flood through the storm that caused it.

Five beats: the raw radar, what changed, how sure we are, where it gets subtle, and who acts on it.

01 · The signal

Radar sees through the cloud.

On 29 October 2024 a DANA storm dropped extreme rain on Valencia. The Spanish government counted 230 deaths. Under that cloud, optical satellites saw nothing useful.

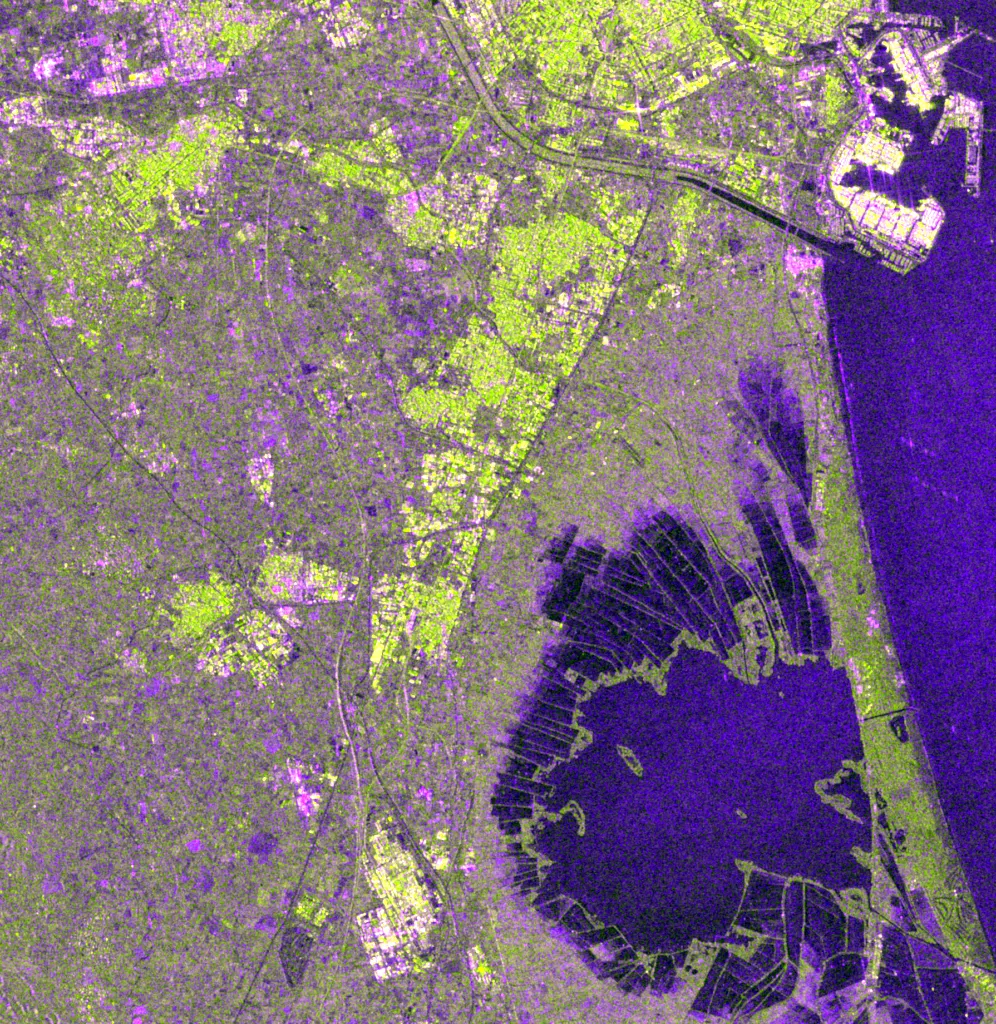
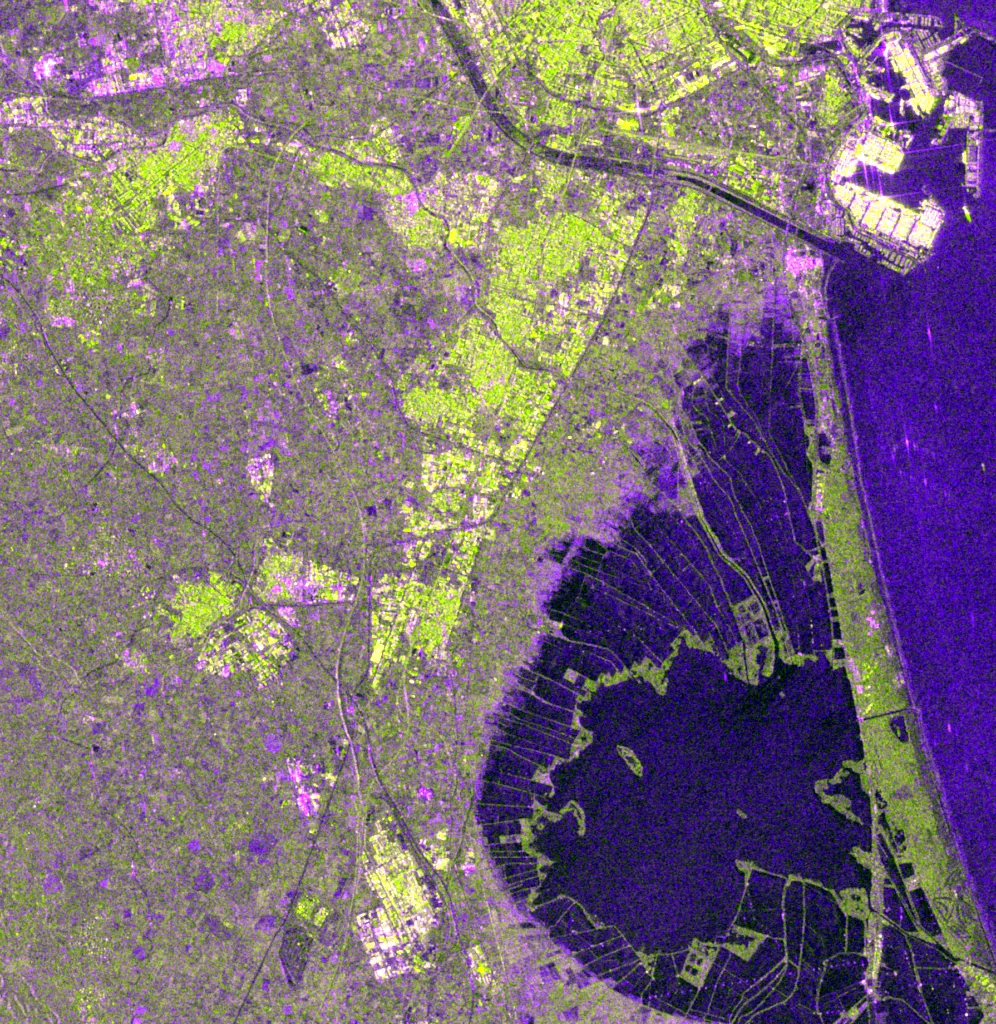
Sentinel-1 radar works through cloud and at night. Smooth water reflects the radar pulse away, so it shows up dark. SAR Change turns those images into a water map anyone can read.

Sentinel-1 radar false colour over Valencia after the flood (VV, VH, VV/VH).

02 · What changed

New water more than doubled in five days.

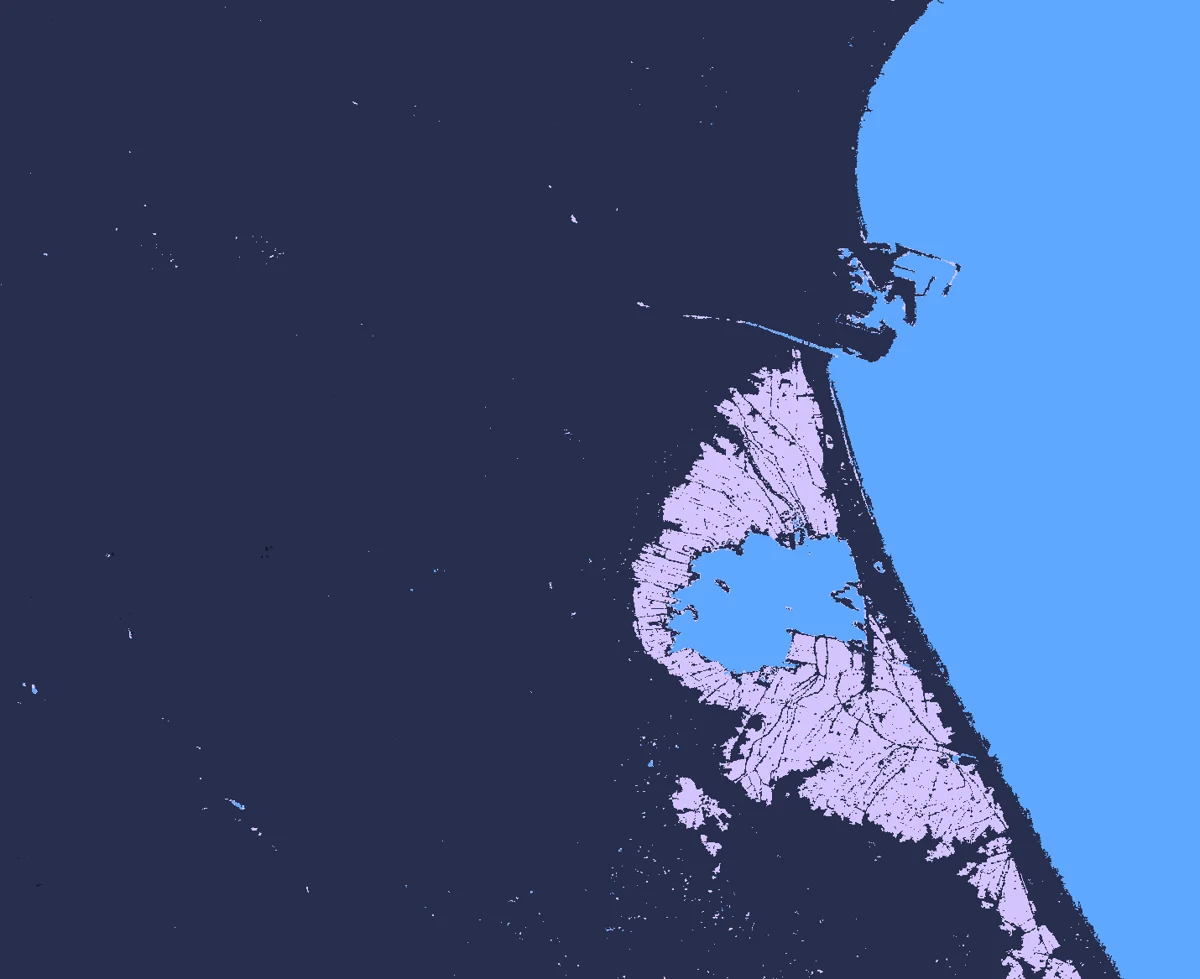
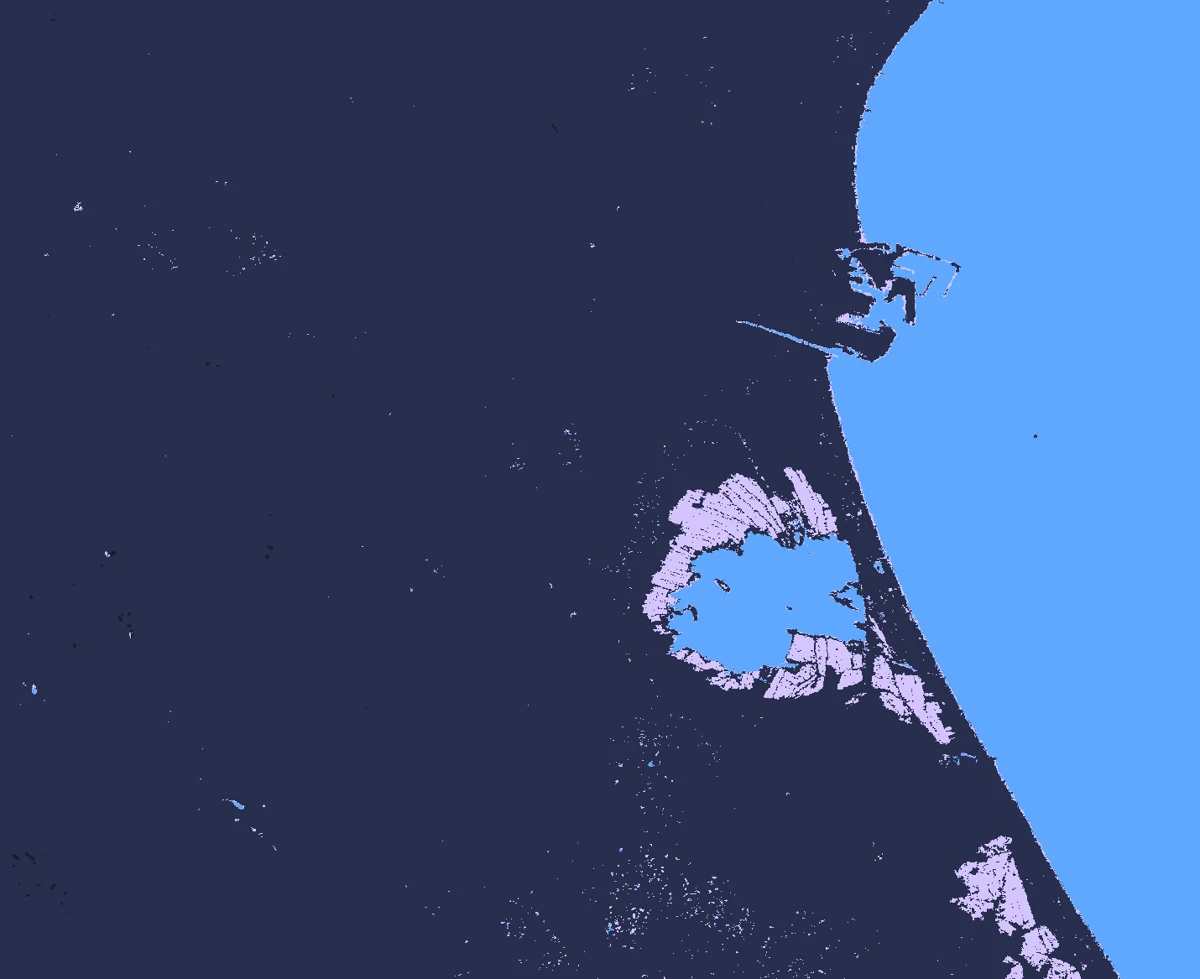
NASA/JPL's OPERA surface-water product, made from the same radar, counts water outside the lagoon and the sea. It rose from 30.7 km² on 26 October to 77.7 km² on 31 October, two days after the storm.

Before: 26 Oct 2024After: 31 Oct 202426 Oct 202431 Oct 2024
Drag to compare. OPERA DSWx-S1 surface water, 30 m.

03 · How sure we are

Two independent water maps, one jump.

Our U-Net, trained on hand-labelled Sen1Floods11 chips, reaches 61.7% water IoU on 90 test chips: 3.0× the standard Otsu threshold (20.3%). OPERA is built separately by NASA/JPL and shows the same jump on 31 October, then 30–60 km² of standing water for three weeks.

On the longer scale, rain and storage tell different stories. Satellite rainfall (GPM IMERG, 1998–2024) shows no trend (annual p = 0.62). GRACE says the ground itself has been losing water: −0.39 cm a year, p = 0.002, a pattern that would turn up by chance about 2 times in 1,000 if nothing were changing.

204060802024-10-01: 4.06 km²1 Oct2024-10-02: 4.88 km²2024-10-07: 3.92 km²2024-10-08: 4.77 km²2024-10-13: 6.62 km²13 Oct2024-10-14: 10.08 km²2024-10-19: 13.33 km²2024-10-20: 12.24 km²2024-10-25: 25.01 km²25 Oct2024-10-26: 30.73 km²2024-10-31: 77.7 km²2024-11-01: 54.26 km²2024-11-06: 40.63 km²6 Nov2024-11-07: 61.45 km²2024-11-12: 48.38 km²2024-11-13: 52.63 km²2024-11-18: 31.66 km²18 Nov2024-11-19: 51.96 km²
New water outside usual water, km², per OPERA pass (≥ 80% valid pixels). Lighter bars: after the 29 October storm.
↑ significant rise↓ significant fall– no significant trend

Are Valencia's rain extremes rising?

Reanalysis and satellite agree: no trend
  • –MERRA-2 wettest day (NASA POWER)p = 0.28
  • –GPM IMERG wettest monthp = 0.21
  • –GPM IMERG annual totalp = 0.62

Is eastern Spain's stored water changing?

One record: falling
  • ↓GRACE/GRACE-FO water storagep = 0.002
Mann-Kendall test at α = 0.05 on one value per year. Each row asks one question of several independent NASA records.

04 · The nuance

What the radar can't see.

The Albufera rice paddies were already filling before the storm (4 km² on 1 October, 31 km² on 26 October), so only the jump to 77.7 km² is the flood. Radar misses water between buildings, so the urban flooding in l'Horta Sud is under-detected, and much of it drained before the first pass.

NISAR's L-band GCOV products start in October 2025, after this flood, so the viewer is NISAR-ready rather than NISAR-built. One extreme event isn't a trend.

The same radar view before the flood. Built-up areas scatter strongly, which hides water in the streets.

05 · Who acts on it

Where the water stayed.

Civil protection, responders and insurers need to know where water is standing days later, not just where it fell. A radar map available through cloud tells them where to send pumps, check access and verify claims first.

The trend layer adds the slow story: rain extremes aren't trending, but stored water is falling. Planners should prepare for the extreme event itself rather than expect a steady rise in rain.

Launch the dashboard
What this means

77.7 km²of new surface water on 31 October

Up from 30.7 km² five days earlier (OPERA DSWx-S1, 30 m).

The Albufera paddies were already rising; urban water is under-detected.
Sentinel-1 radar false colour over Valencia after the flood (VV, VH, VV/VH).
Before: 26 Oct 2024After: 31 Oct 202426 Oct 202431 Oct 2024
Drag to compare. OPERA DSWx-S1 surface water, 30 m.
204060802024-10-01: 4.06 km²1 Oct2024-10-02: 4.88 km²2024-10-07: 3.92 km²2024-10-08: 4.77 km²2024-10-13: 6.62 km²13 Oct2024-10-14: 10.08 km²2024-10-19: 13.33 km²2024-10-20: 12.24 km²2024-10-25: 25.01 km²25 Oct2024-10-26: 30.73 km²2024-10-31: 77.7 km²2024-11-01: 54.26 km²2024-11-06: 40.63 km²6 Nov2024-11-07: 61.45 km²2024-11-12: 48.38 km²2024-11-13: 52.63 km²2024-11-18: 31.66 km²18 Nov2024-11-19: 51.96 km²
New water outside usual water, km², per OPERA pass (≥ 80% valid pixels). Lighter bars: after the 29 October storm.
↑ significant rise↓ significant fall– no significant trend

Are Valencia's rain extremes rising?

Reanalysis and satellite agree: no trend
  • –MERRA-2 wettest day (NASA POWER)p = 0.28
  • –GPM IMERG wettest monthp = 0.21
  • –GPM IMERG annual totalp = 0.62

Is eastern Spain's stored water changing?

One record: falling
  • ↓GRACE/GRACE-FO water storagep = 0.002
Mann-Kendall test at α = 0.05 on one value per year. Each row asks one question of several independent NASA records.
The same radar view before the flood. Built-up areas scatter strongly, which hides water in the streets.

What this means

77.7 km²of new surface water on 31 October

Up from 30.7 km² five days earlier (OPERA DSWx-S1, 30 m).

The Albufera paddies were already rising; urban water is under-detected.
  1. The signal
  2. What changed
  3. How sure we are
  4. The nuance
  5. Who acts on it

Who uses it

One person, one decision, start to finish.

The path through the dashboard, from the situation they start in to the decision it changes.

Valencia / l'Horta Sud

Flood-response coordinator

  1. Before

    After 29 October 2024 the sky is closed, the public can't read a radar image, and there's a risk of treating one disaster as proof that autumns are getting wetter.

  2. Step 1

    Viewer tab: swipe before/after on the same orbit (26 Oct vs 7 Nov), then scrub the time-lapse.

  3. Step 2

    Read "Why radar works here".

  4. Step 3

    On the module page: OPERA new water, 30.7 → 77.7 km², with the paddy and urban caveats.

  5. Step 4

    Trend layer: no rain trend in POWER or IMERG; GRACE storage falling.

  6. Decision

    Brief the flood as a cloud-proof, quantified jump in new water, with urban flooding undercounted, and not as evidence of a wetter climate.

  7. After

    A swipeable radar story, an OPERA number with a date, and tested climate context that prevents a false trend claim.

Who benefits
Responders and the residents they need to reach.
Decision it improves
Showing where water went when optical satellites are blind, without overstating what one event means.

An illustrative journey built from what the dashboard does today, not a field-tested outcome.

Launch the dashboard

Valencia region

Municipal engineer or insurer

  1. Before

    They need a footprint for drainage design or a loss estimate, and a view on whether this is the new normal.

  2. Step 1

    Swipe the radar and read the OPERA series.

  3. Step 2

    Apply the caveats: paddies already filling before the storm, urban water under-detected.

  4. Step 3

    Read the trend layer and the GRACE mascon map: drying storage, no rain trend.

  5. Decision

    Treat urban loss as larger than the radar footprint, and plan for an extreme event on a drying water-storage background, not a proven rise in extreme rain.

  6. After

    A bounded statement: what the radar saw, what it missed, and what the 20- to 45-year tests do and don't support.

Who benefits
Ratepayers and policyholders in flood-prone districts.
Decision it improves
Sizing drainage or cover from evidence with its limits stated, rather than from one image.

An illustrative journey built from what the dashboard does today, not a field-tested outcome.

Launch the dashboard
WhatConfirm through cloud and night

What the module delivers.

  • Radar before/after and time-lapse of the Valencia flood
  • A water model that triples the standard threshold's overlap
  • NASA OPERA radar water maps and NISAR granules, plus 45-year rain and 23-year water-storage trends
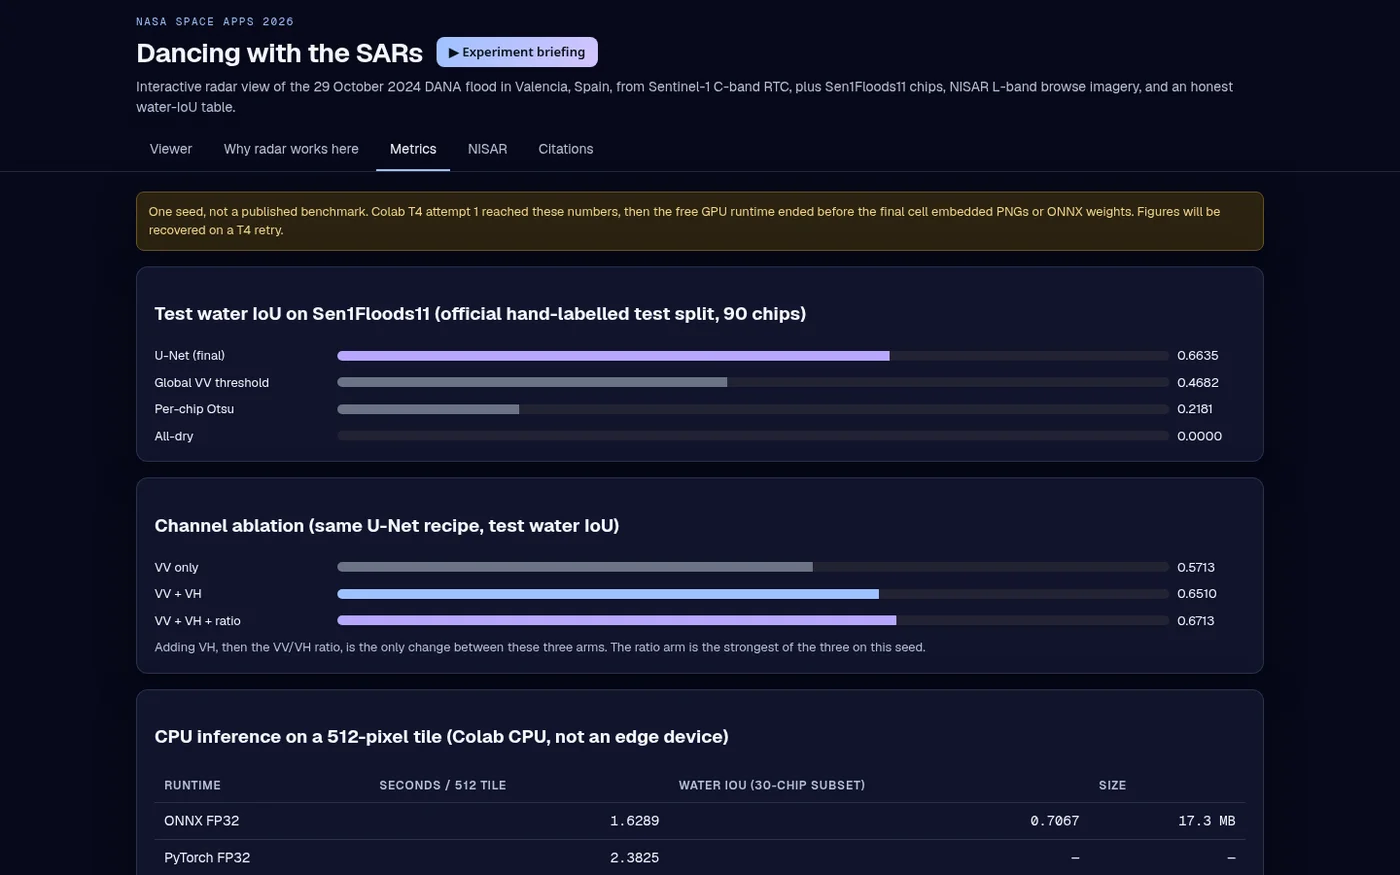
water IoU, 90 test chips66.4%

U-Net water overlap on Sen1Floods11's official hand-labelled test split.

per-chip Otsu21.8%

The standard automatic threshold, on the same chips. A single tuned VV threshold reaches 46.8%.

VV 57.1% → VV+VH 65.1%67.1%

Channel ablation: adding VH and the VV/VH ratio each help.

ONNX FP32, CPU1.63 s

Per 512×512 tile on a CPU. INT8 kept accuracy but was about 9× slower on that CPU, so FP32 stays.

4 orbit tracks26

Sentinel-1 radar passes in the Valencia viewer.

55 + 67 + 76198

NISAR L2 GCOV granules found via NASA CMR over Valencia, Toronto and Jasper.

Held-out test data, compared against baselines. One seed per run, not a published benchmark.

Before and after

The flood, through the clouds

Before: 26 Oct 2024 (3 days before)After: 7 Nov 2024 (9 days after) 26 Oct 2024 (3 days before)7 Nov 2024 (9 days after)
Sentinel-1 false colour (VV, VH, VV/VH), ascending track 1755 over Valencia. Drag to compare. Dark areas are smooth surfaces such as standing water.

Visuals

Inside the tool

Metrics tab: test water IoU against baselines, channel ablation and CPU timing.

Earthdata upgrade · NASA OPERA

NASA OPERA confirms the water

Before: 26 Oct 2024 (before)After: 31 Oct 2024 (2 days after) 26 Oct 2024 (before)31 Oct 2024 (2 days after)
OPERA DSWx-S1 water classes, about 0.63–0.20°W, 39.20–39.55°N. Purple: water that wasn't there in early October. Blue: usual water (Albufera lagoon, sea, port).

We added NASA/JPL OPERA DSWx-S1, a surface-water map made from Sentinel-1 radar at 30 m, downloaded with an Earthdata login. 18 radar passes between 1 October and 19 November 2024 cover the coast south of Valencia. Outside water that was already there in early October, new water rose from 30.7 km² on 26 October to 77.7 km² on 31 October, two days after the flood, then stayed between about 30 and 60 km² for the next three weeks.

Read it with care. Most of the new water sits in the Albufera rice paddies around the lagoon, and it was already rising before the flood (from 4 km² on 1 October to 31 km² on 26 October), so the flood signal is the jump to 77.7 km². Radar water maps miss water between buildings, so the urban flooding in l'Horta Sud is under-detected, and much of it had drained by the first pass. Passes with under 80% valid pixels are left out.

New water outside usual water, km² · OPERA DSWx-S1, 30 m

29 Oct flood204060802024-10-01 descending: 4.06 km²1 Oct2024-10-02 ascending: 4.88 km²2024-10-07 ascending: 3.92 km²2024-10-08 descending: 4.77 km²8 Oct2024-10-13 descending: 6.62 km²2024-10-14 ascending: 10.08 km²2024-10-19 ascending: 13.33 km²19 Oct2024-10-20 descending: 12.24 km²2024-10-25 descending: 25.01 km²2024-10-26 ascending: 30.73 km²26 Oct2024-10-31 ascending: 77.7 km²77.7 km²2024-11-01 descending: 54.26 km²2024-11-06 descending: 40.63 km²6 Nov2024-11-07 ascending: 61.45 km²2024-11-12 ascending: 48.38 km²2024-11-13 descending: 52.63 km²13 Nov2024-11-18 descending: 31.66 km²2024-11-19 ascending: 51.96 km²
Each bar is one radar pass with at least 80% valid pixels. Hover or tap a bar for its date and area.

Trend layer · Water

Was the Valencia flood part of a trend?

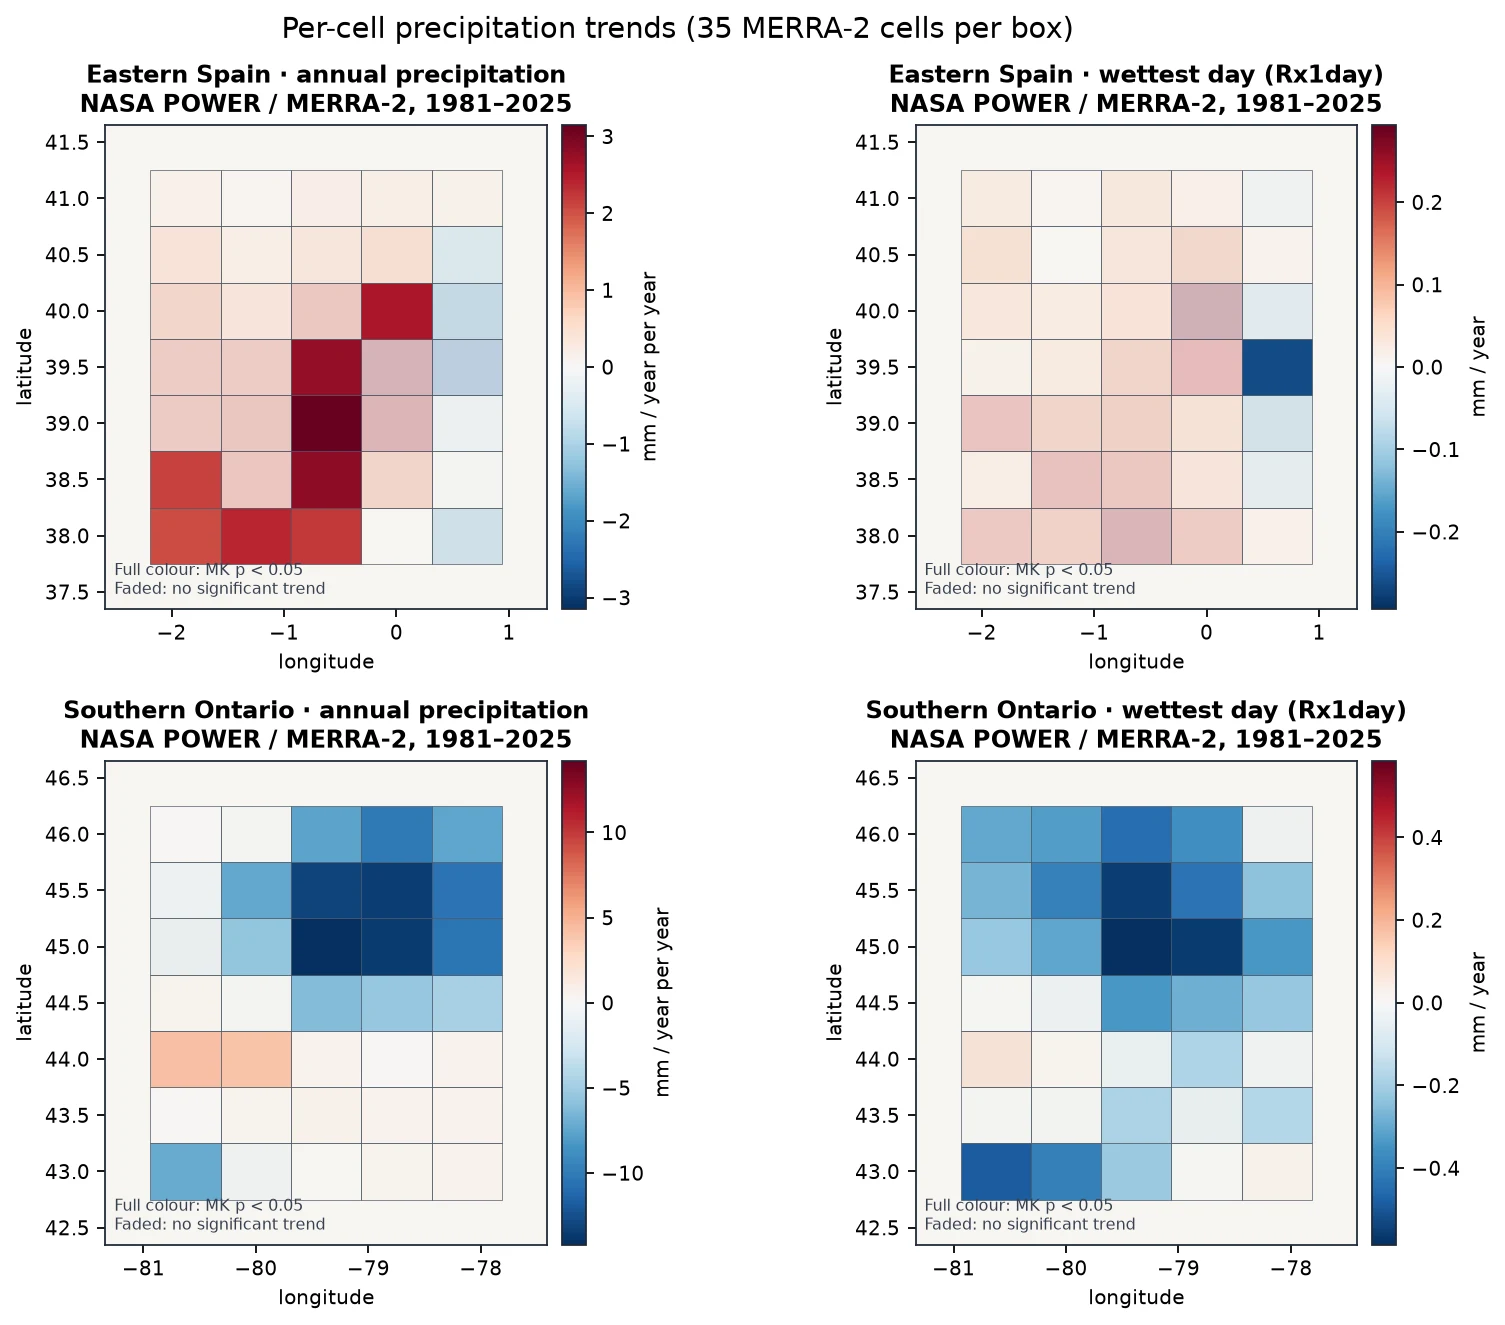
A flood map shows one event. To ask if heavy rain is changing, we tested 45 years (1981–2025) of NASA POWER daily precipitation over eastern Spain (around Valencia) and southern Ontario (around Toronto, a NISAR site in the viewer): annual totals, the wettest day of each year, and heavy-rain days.

  • Valencia: no significant trend in extremes. Wettest-day rain +0.08 mm a year (p = 0.28) and heavy-rain days (p = 0.44) don't trend in this reanalysis record. The 2024 DANA flood was extreme, but one extreme isn't a trend.
  • Annual totals: a patchy rise. 8 of the 35 cells around Valencia show a significant rise in annual precipitation, including the cell over the city; the regional mean doesn't (p = 0.24).
  • Southern Ontario: a reanalysis signal satellites don't confirm. In MERRA-2 reanalysis (NASA POWER), wettest-day rain falls −0.24 mm a year and days with ≥ 20 mm fall −0.06 a year (both p < 0.001). GPM IMERG satellite rainfall over 1998–2024 shows no significant trend in the annual total (p = 0.28) or the wettest month (p = 0.36), so we don't claim Ontario's rain extremes are falling.
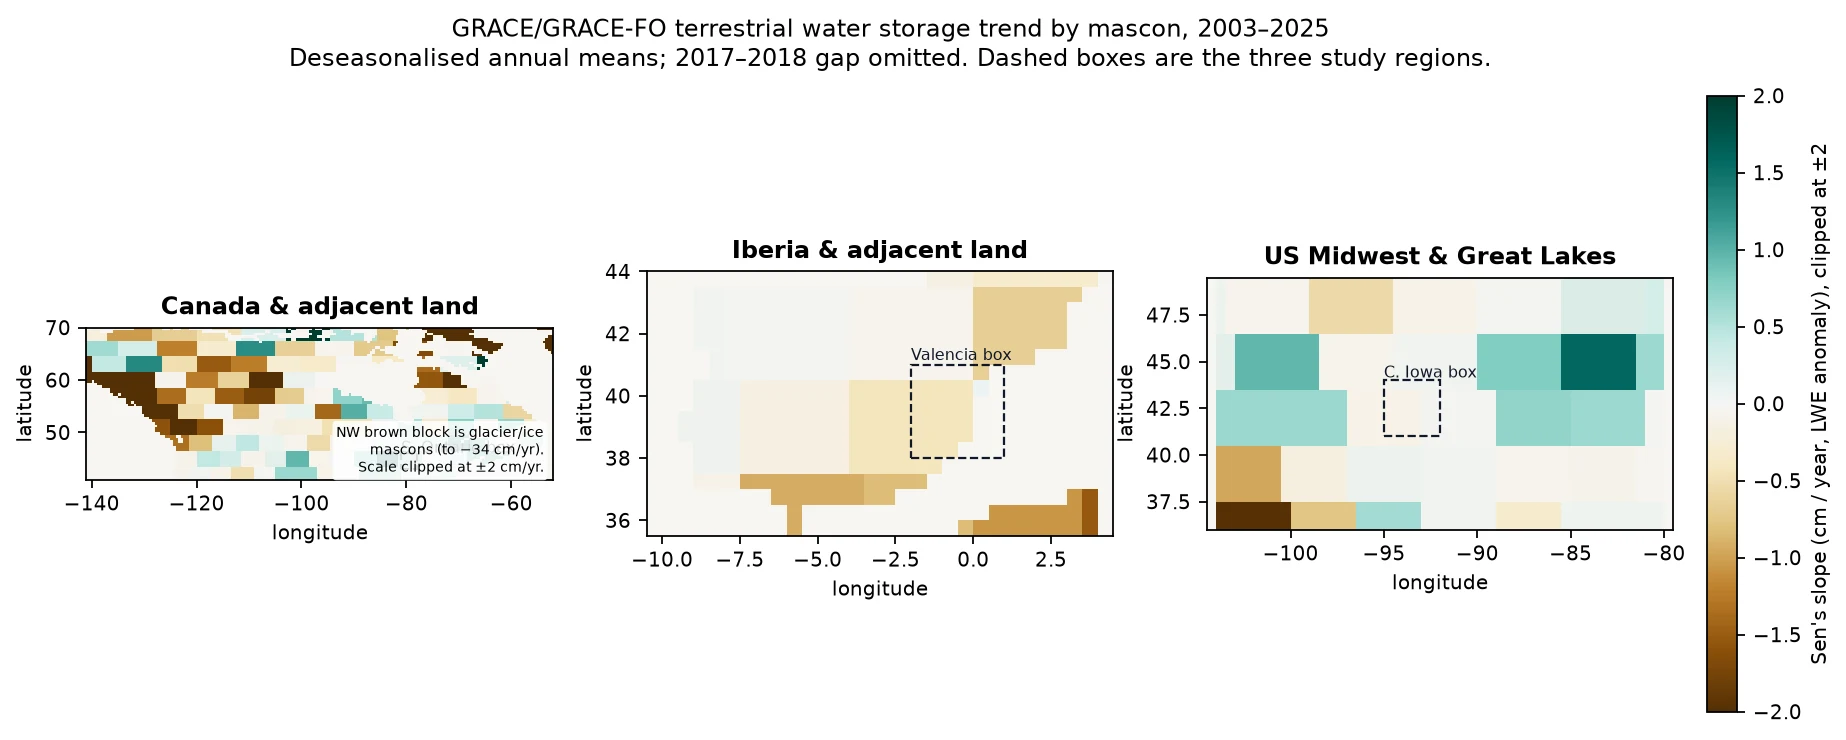
  • Drying ground, then a flash flood. GRACE/GRACE-FO gravity satellites show total water storage over eastern Spain falling by about 0.39 cm a year over 2003–2025 (p = 0.002, Earthdata login). Rain extremes didn't trend, but the land was holding less water before the DANA struck. Southern Ontario's storage is rising (+0.55 cm a year, p = 0.014).
  • Cross-checked with satellite rainfall. GPM IMERG V07 (monthly, 0.1°, Earthdata login) over 1998–2024 agrees for eastern Spain: no significant trend in the annual total (p = 0.62), the September–November total (p = 0.80) or the wettest month (p = 0.21). One extreme event isn't a trend.

Mann-Kendall (α = 0.05) and Sen's slope with 95% CI, one value per year. Hover or tap the chart for yearly values.

Where it is changing

Trend maps

Per-cell trends in NASA POWER (MERRA-2) precipitation, 1981–2025, 35 cells per box. Eastern Spain: 8 cells with a significant rise in annual total, none in the wettest day. Southern Ontario's decreases here are not confirmed by GPM IMERG.
GRACE/GRACE-FO mascon trends, 2003–2025 (cm a year, clipped at ±2). The Valencia box sits in a flat-to-drying area; Great Lakes mascons are rising. Faded mascons are not significant.
HowApproach, data and limits

The approach

  1. Stack same-orbit radar

    26 Sentinel-1 RTC passes over four orbit tracks around Valencia (Sept–Dec 2024). Each orbit shares one colour stretch, so the time-lapse doesn't flicker.

  2. Show the change

    Before/after swipe, time-lapse and a VV dB change map for three same-track pairs that bracket the flood.

  3. Learn water from radar

    A U-Net trained on Sen1Floods11's hand-labelled chips, tuned with 14 Optuna trials, and compared against Otsu and a global VV threshold.

  4. Explain the physics

    Why calm water looks dark, what VV and VH mean, and why NISAR's L-band can see flooding under vegetation where C-band can't.

  5. Connect to NISAR

    NISAR L2 GCOV granules found through NASA CMR (Valencia 55, Toronto 67, Jasper 76), with public browse images in the viewer and hooks for full NISAR files.

Limits we know about

  • One seed (Colab attempt 1); the free GPU session ended before the trained weights were saved, so the viewer shows recorded metrics, not live inference.
  • The NISAR browse images are from 2025–2026, not the 2024 flood. NISAR launched after the event; the flood itself is shown with Sentinel-1.
  • Full NISAR .h5 products need an Earthdata login and aren't bundled.
DatasetHow it's usedAccessLink
NASA-ISRO NISAR L2 GCOV (metadata + browse)Granule search via NASA CMR; public browse images from ASF DAACsource
Sentinel-1 RTC (ESA Copernicus)VV/VH backscatter, 10 m, Valencia, Sept–Dec 2024; RTC via Microsoft Planetary Computersource
Sen1Floods11 (CC-BY-4.0)Hand-labelled Sentinel-1 flood chips (Bonafilia et al., 2020)source
JRC Global Surface WaterPermanent-water reference overlay on the test chipssource
NASA POWER daily PRECTOTCORR (trend layer)Daily precipitation 1981–2025 (MERRA-2 based), 35 cells per region; Mann-Kendall + Sen's slopesource
GRACE/GRACE-FO JPL mascon RL06.3 CRI v04 (trend layer)Monthly total water storage 2002–2026, land cells over eastern Spain and southern Ontario; deseasonalised annual meanssource
GPM IMERG V07 monthly GPM_3IMERGM (trend layer)Satellite rainfall, 0.1°, eastern Spain and southern Ontario boxes, 1998–2024: annual, Sep–Nov and wettest-month totalssource
NASA/JPL OPERA DSWx-S1 (module upgrade)Radar-derived surface water, 30 m, 18 passes 1 Oct–19 Nov 2024 over the Valencia flood zonesource

For the judges

How it maps to the criteria

Impact

Floods are among the most costly disasters, and radar is often the only clear view during the event. Making SAR legible helps responders, journalists and the public.

Creativity

Pairs an interactive swipe and time-lapse with a plain-language physics explainer, and is honest about what C-band can't see and L-band NISAR can.

Validity

Scored on Sen1Floods11's official hand-labelled test split, against two classical baselines, with a channel ablation and CPU timing.

Relevance

Trend Detective: puts the Valencia flood in a 45-year NASA POWER rainfall record and asks whether extremes are trending there and in southern Ontario. The viewer uses real NISAR GCOV granules found via NASA CMR, with browse imagery in the app.

Presentation

Swipe, time-lapse and a 'why radar works here' tab turn a specialist dataset into a story anyone can follow.

First designed around the related Space Apps 2026 brief Dancing with the SARs; here it is the confirm module of one system in Be An Earth System Trend Detective!